> ## Documentation Index
> Fetch the complete documentation index at: https://docs.befailproof.ai/llms.txt
> Use this file to discover all available pages before exploring further.
# Sessions & Execution Graph
> FailproofAI Observability Sessions & Execution Graph documentation.
Stop guessing why a run failed. FailproofAI Observability rolls every event from a run into one readable row, then draws the whole run as a git-style picture you can read in seconds, so you see exactly what your agent did, step by step.
*One row per run: the status pill tells you how the run ended at a glance, and a score badge rides along once an evaluator is connected.*
*Agent tracing: follow a single run step by step, from goal to tools to final answer.*
***
## See every run at a glance
The raw event trail is the truth of every step, but when you have thousands of steps across dozens of runs, you need the run, not the step. The Sessions page rolls all of a run's events up into one row, so a day of activity becomes a scannable list instead of a firehose.
Each row carries a status pill, so a failed run stands out from a healthy one before you click anything. Filter by date range, environment, agent, or session to go from "everything" to "the run I care about" in a couple of clicks.
Once you connect an evaluator, every completed run is scored automatically and its latest score shows up on the row as a badge. You can filter by any score range, so "show me every low-scoring prod run this week" is a filter, not a manual review. Until you set one up, sessions still capture the full run; they just don't carry a score yet.
***
## Read the whole run as a picture
*The execution graph (left) sits beside the event timeline; the right rail breaks down the tools, models, hooks, and token spend for the run.*
Click any session to open its execution graph: a git-style view of how agents, tools, hooks, and model calls unfolded over time. Parallel sub-agents each branch onto their own lane, so you can see which work ran side by side, which sub-agent stalled, and where the run went off course, without replaying it in your head from a wall of logs.
The right rail gives you the per-run breakdown: which tools and models ran, which hooks fired, and what the run spent in tokens. That is the answer to "why did this run cost so much?" or "which tool is the slow one?" sitting right next to the graph that caused it.
***
## Where to find it
Every dashboard page is scoped to your org (`//…`). Sessions lives under **Observe** in the left sidebar, next to Events, with the date range, environment, agent, and session filters across the top of the list. Every row is one click from its full execution graph.
To turn on the score badges and score-range filtering, connect an evaluator: see [Evaluations](/agenteye/evaluations).
***
## Related
* [Event stream](/agenteye/event-stream): the raw, per-step trail every session is rolled up from.
* [Evaluations](/agenteye/evaluations): connect an evaluator so each run gets a score badge you can filter by.
* [Telemetry](/agenteye/telemetry): how runs get from your agent into these sessions.
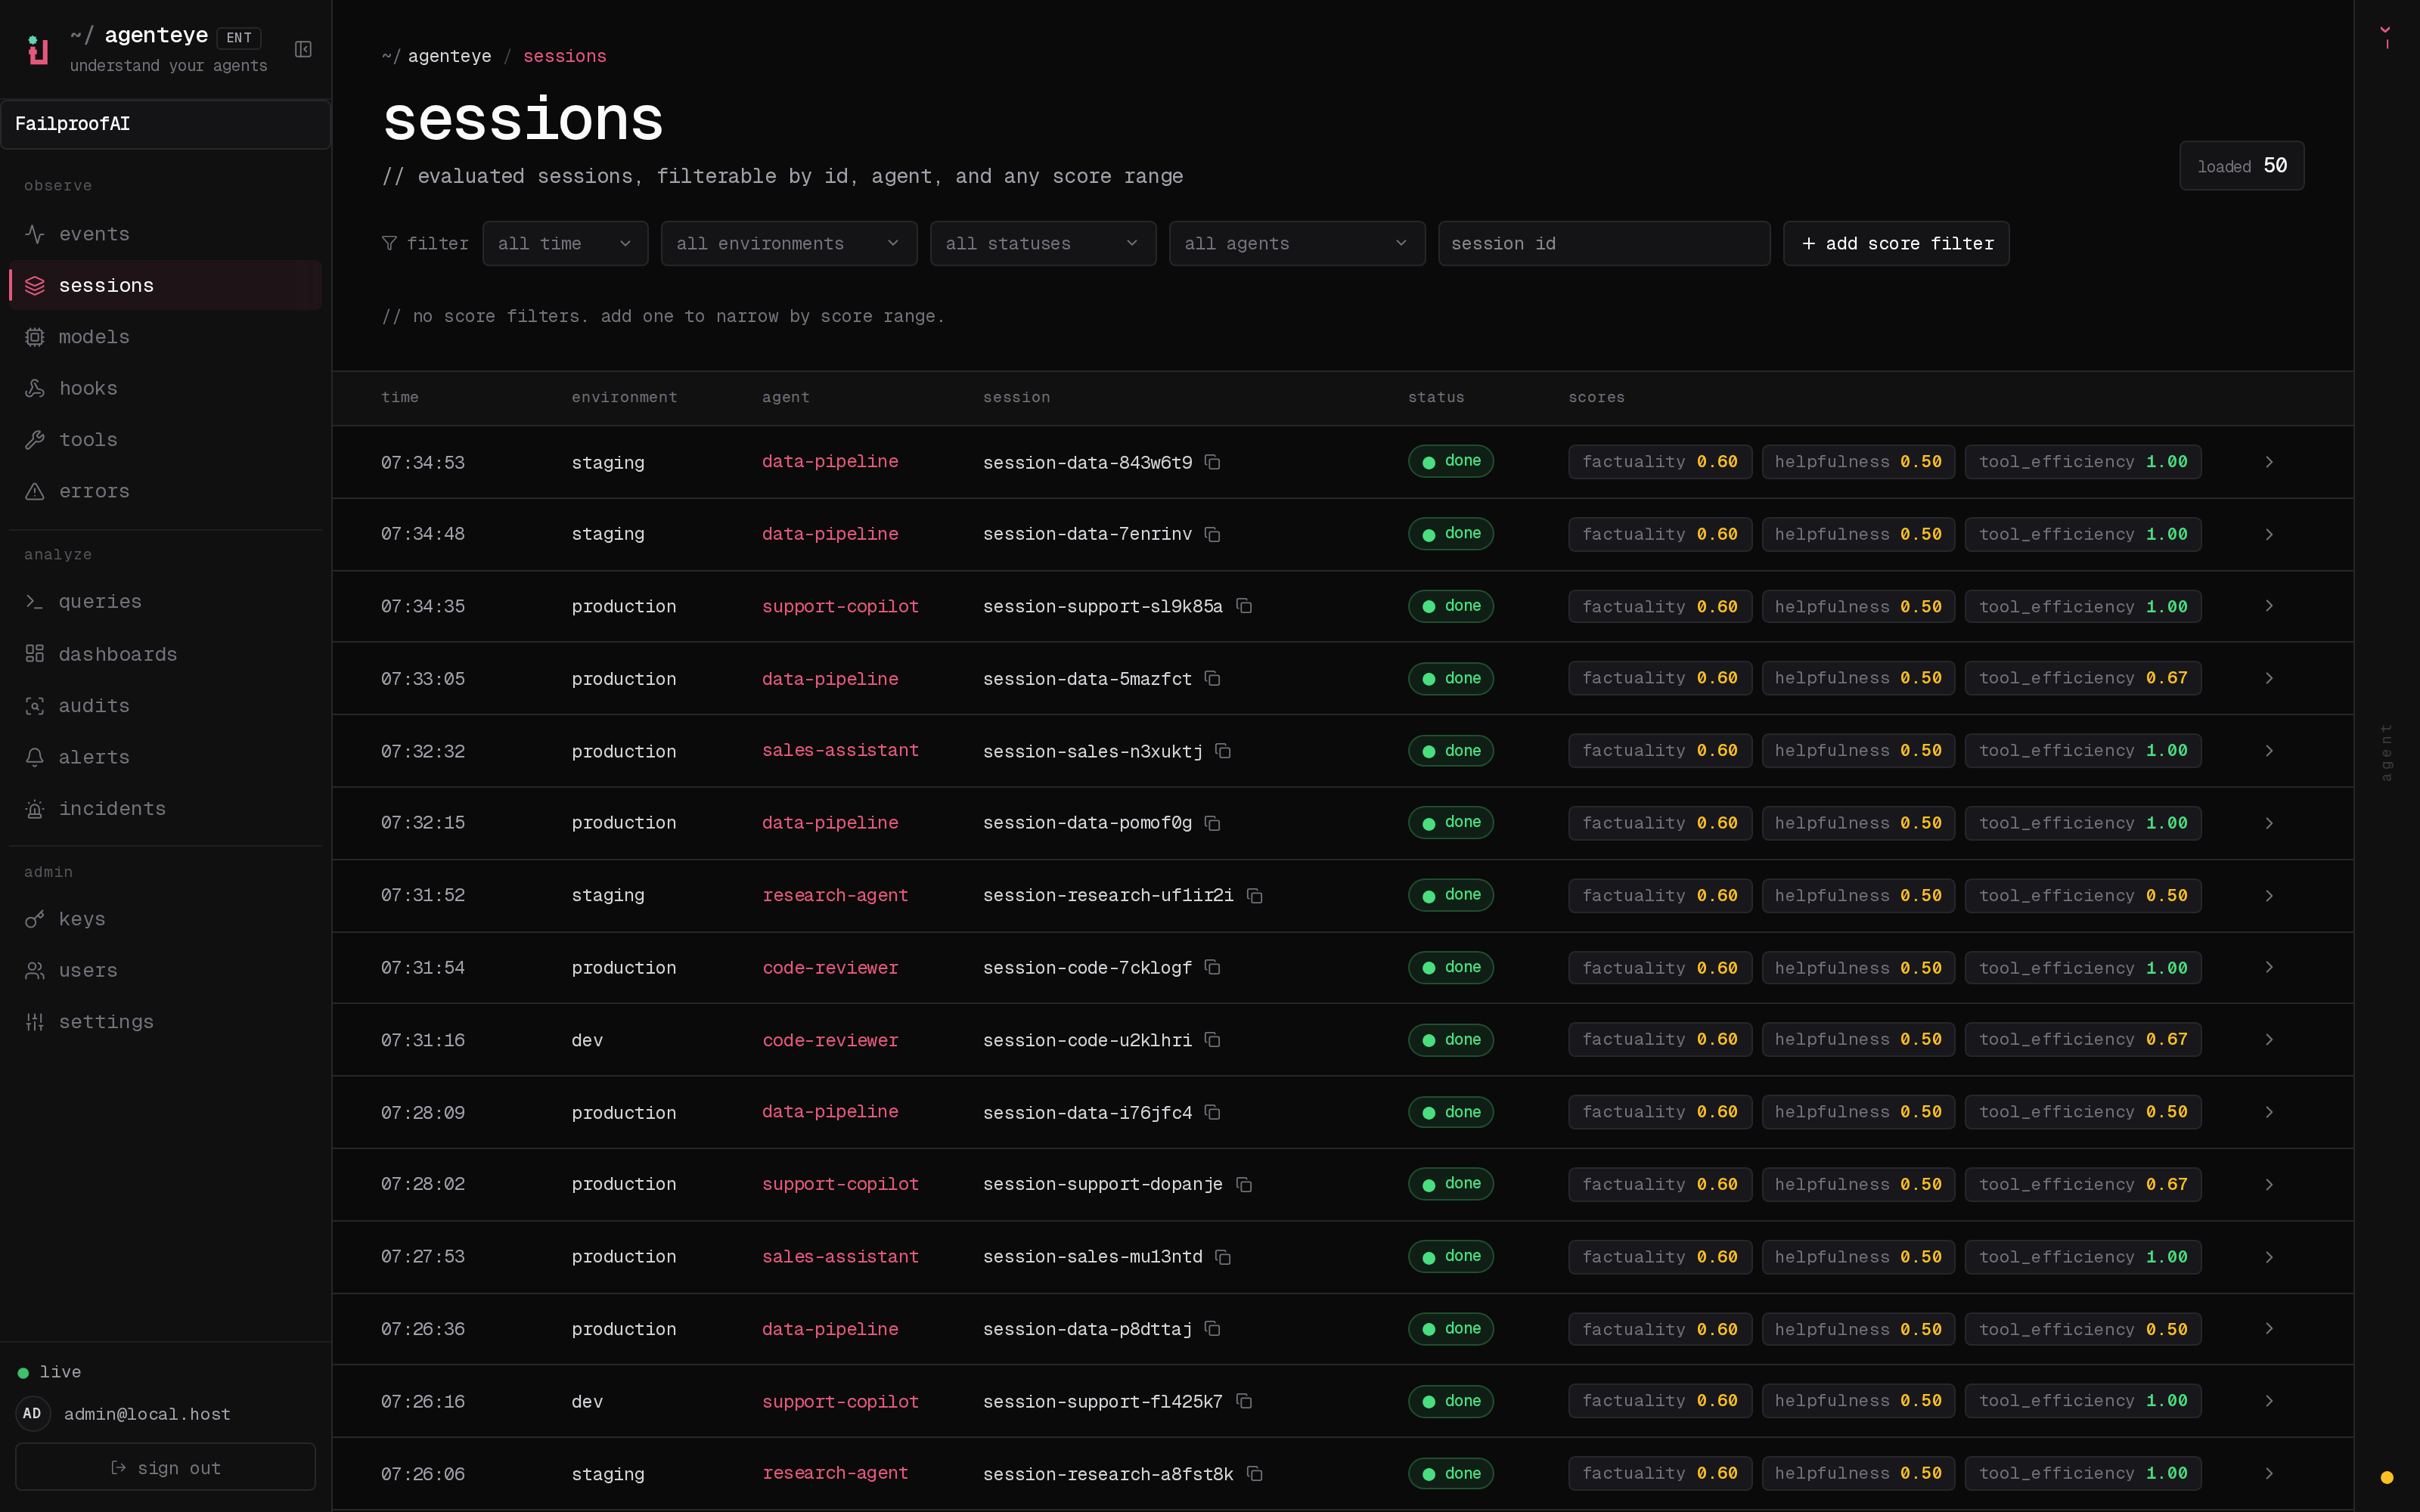 *One row per run: the status pill tells you how the run ended at a glance, and a score badge rides along once an evaluator is connected.*
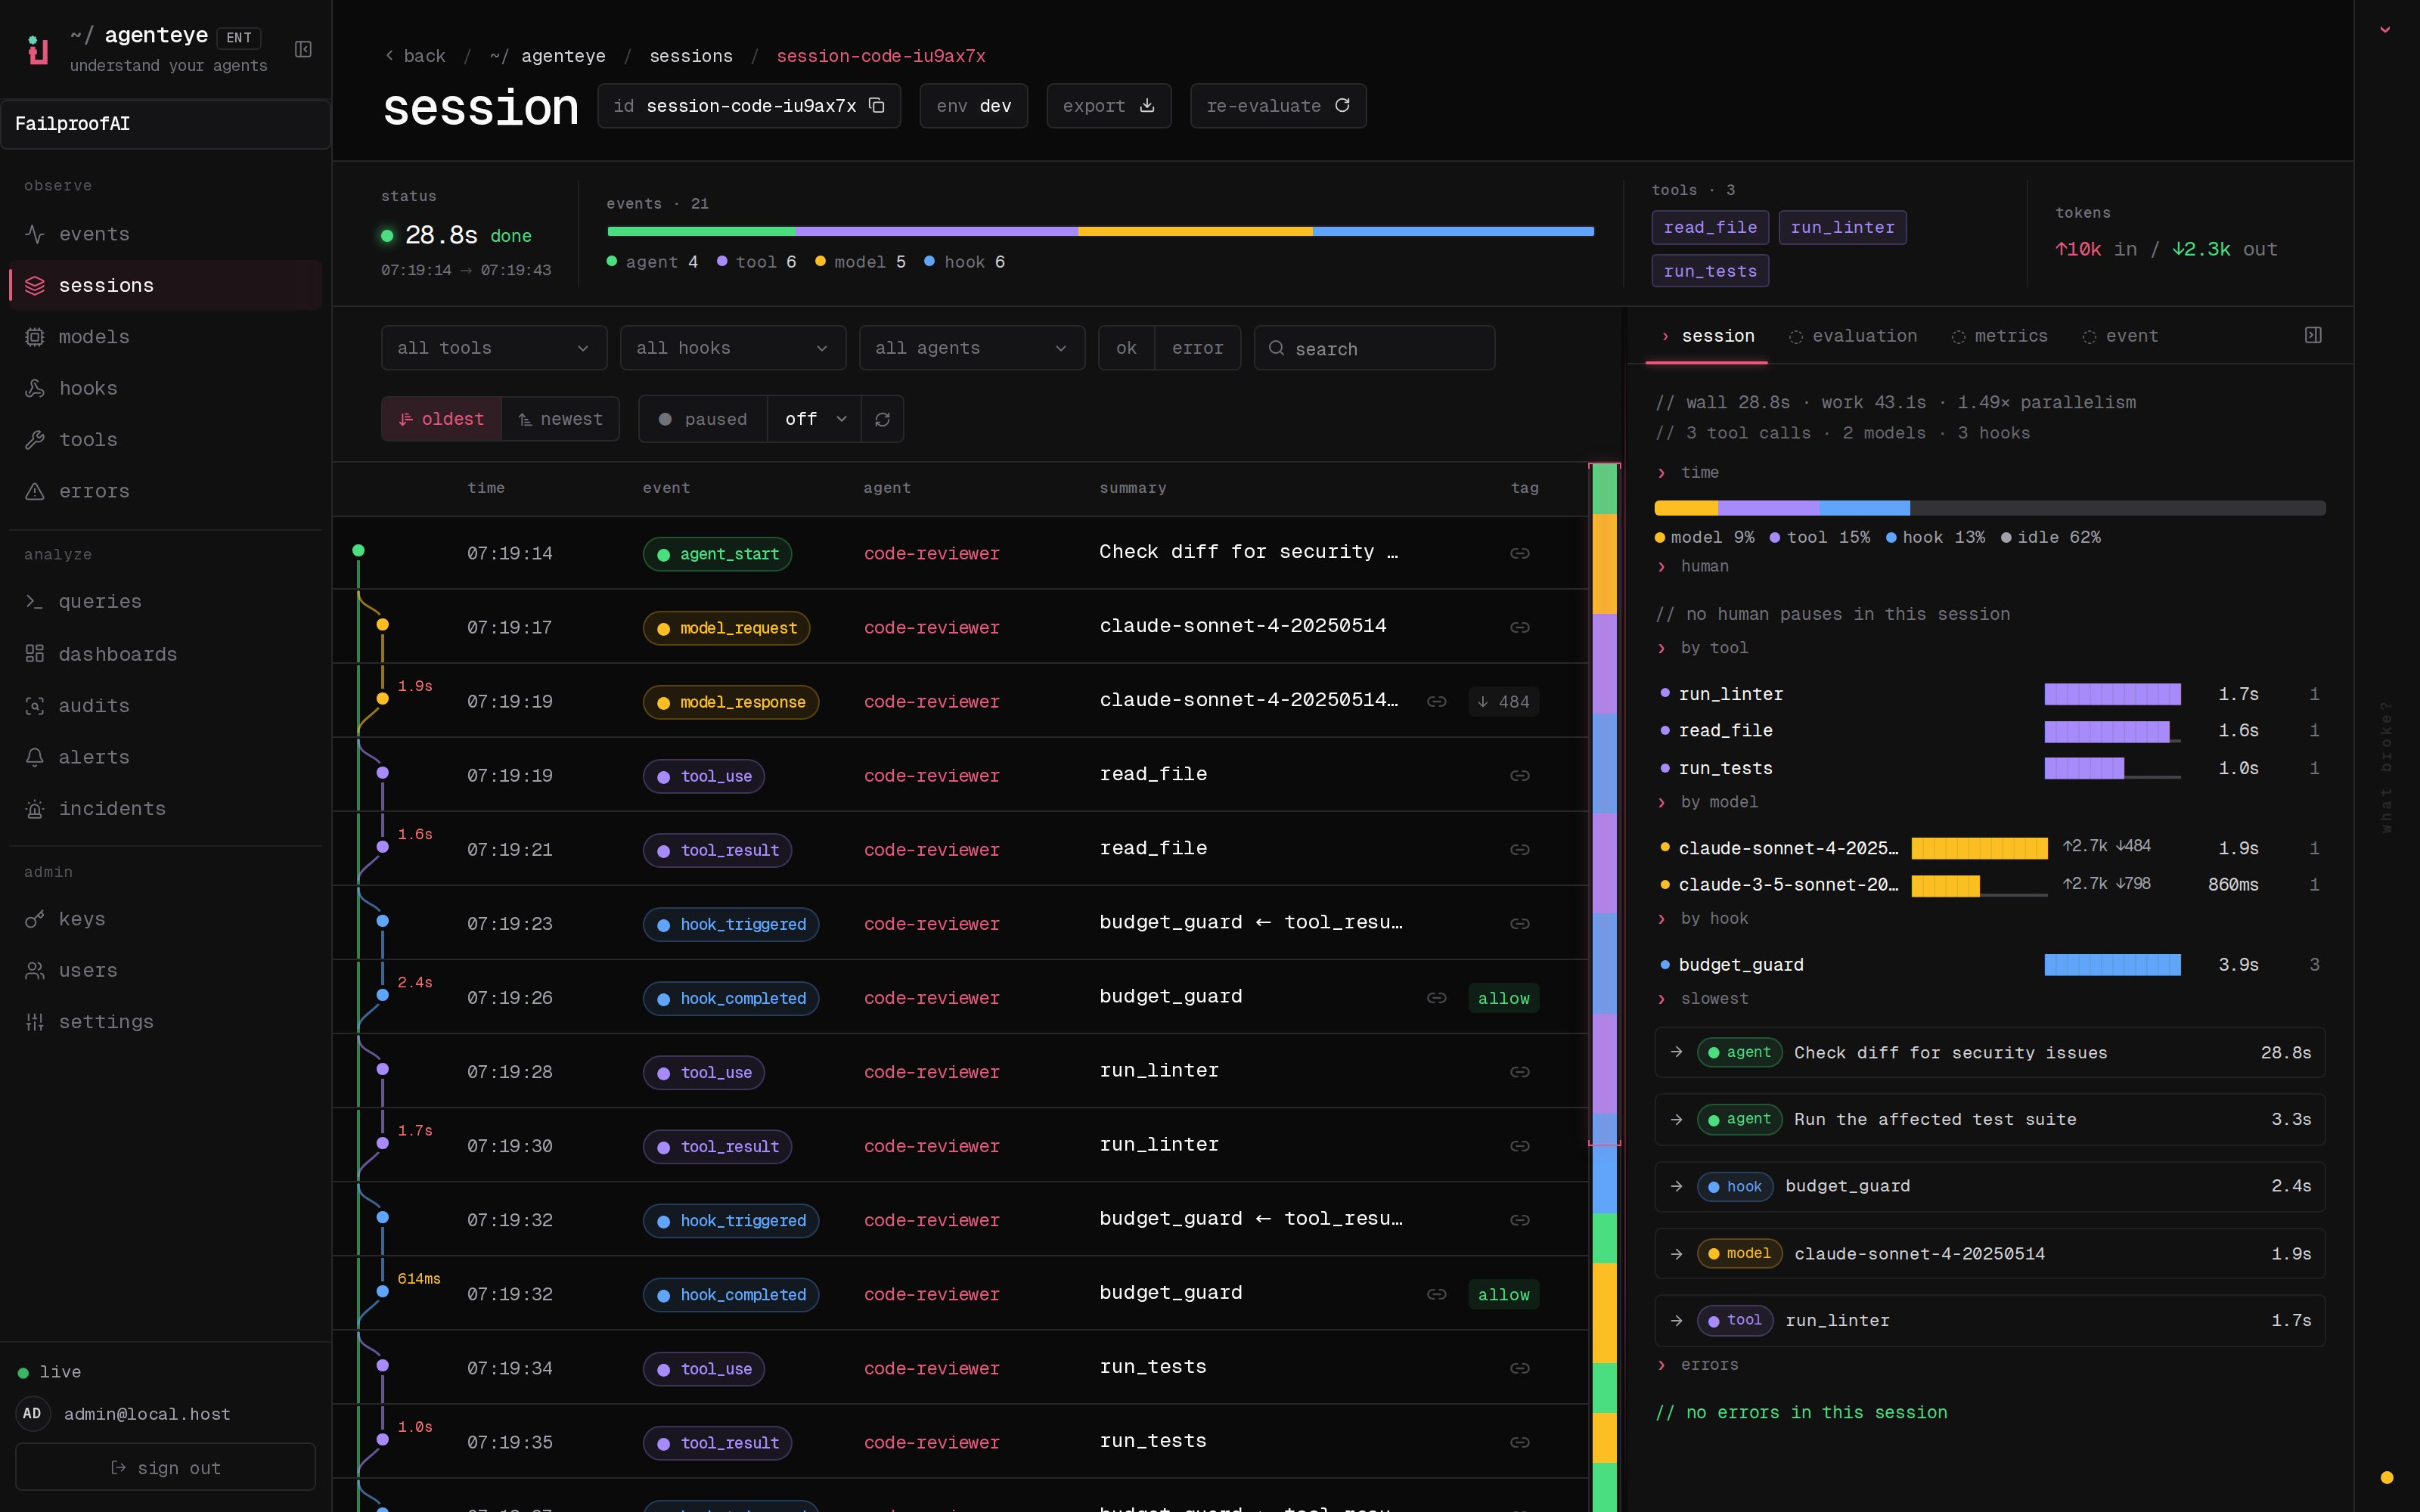 *The execution graph (left) sits beside the event timeline; the right rail breaks down the tools, models, hooks, and token spend for the run.*
Click any session to open its execution graph: a git-style view of how agents, tools, hooks, and model calls unfolded over time. Parallel sub-agents each branch onto their own lane, so you can see which work ran side by side, which sub-agent stalled, and where the run went off course, without replaying it in your head from a wall of logs.
The right rail gives you the per-run breakdown: which tools and models ran, which hooks fired, and what the run spent in tokens. That is the answer to "why did this run cost so much?" or "which tool is the slow one?" sitting right next to the graph that caused it.
***
## Where to find it
Every dashboard page is scoped to your org (`/
*The execution graph (left) sits beside the event timeline; the right rail breaks down the tools, models, hooks, and token spend for the run.*
Click any session to open its execution graph: a git-style view of how agents, tools, hooks, and model calls unfolded over time. Parallel sub-agents each branch onto their own lane, so you can see which work ran side by side, which sub-agent stalled, and where the run went off course, without replaying it in your head from a wall of logs.
The right rail gives you the per-run breakdown: which tools and models ran, which hooks fired, and what the run spent in tokens. That is the answer to "why did this run cost so much?" or "which tool is the slow one?" sitting right next to the graph that caused it.
***
## Where to find it
Every dashboard page is scoped to your org (`/