> ## Documentation Index
> Fetch the complete documentation index at: https://docs.befailproof.ai/llms.txt
> Use this file to discover all available pages before exploring further.
# Error Tracking
> FailproofAI Observability Error Tracking documentation.
अपने agents द्वारा उत्पन्न प्रत्येक विफलता को एक जगह देखें, जहां grouped होने से एक बड़ा burst एक ही समस्या के रूप में दिखता है। आपको "something is red" से लेकर उस exact run तक एक-क्लिक पहुंच मिलती है जो टूटा है, बिना live feed को scroll करे।
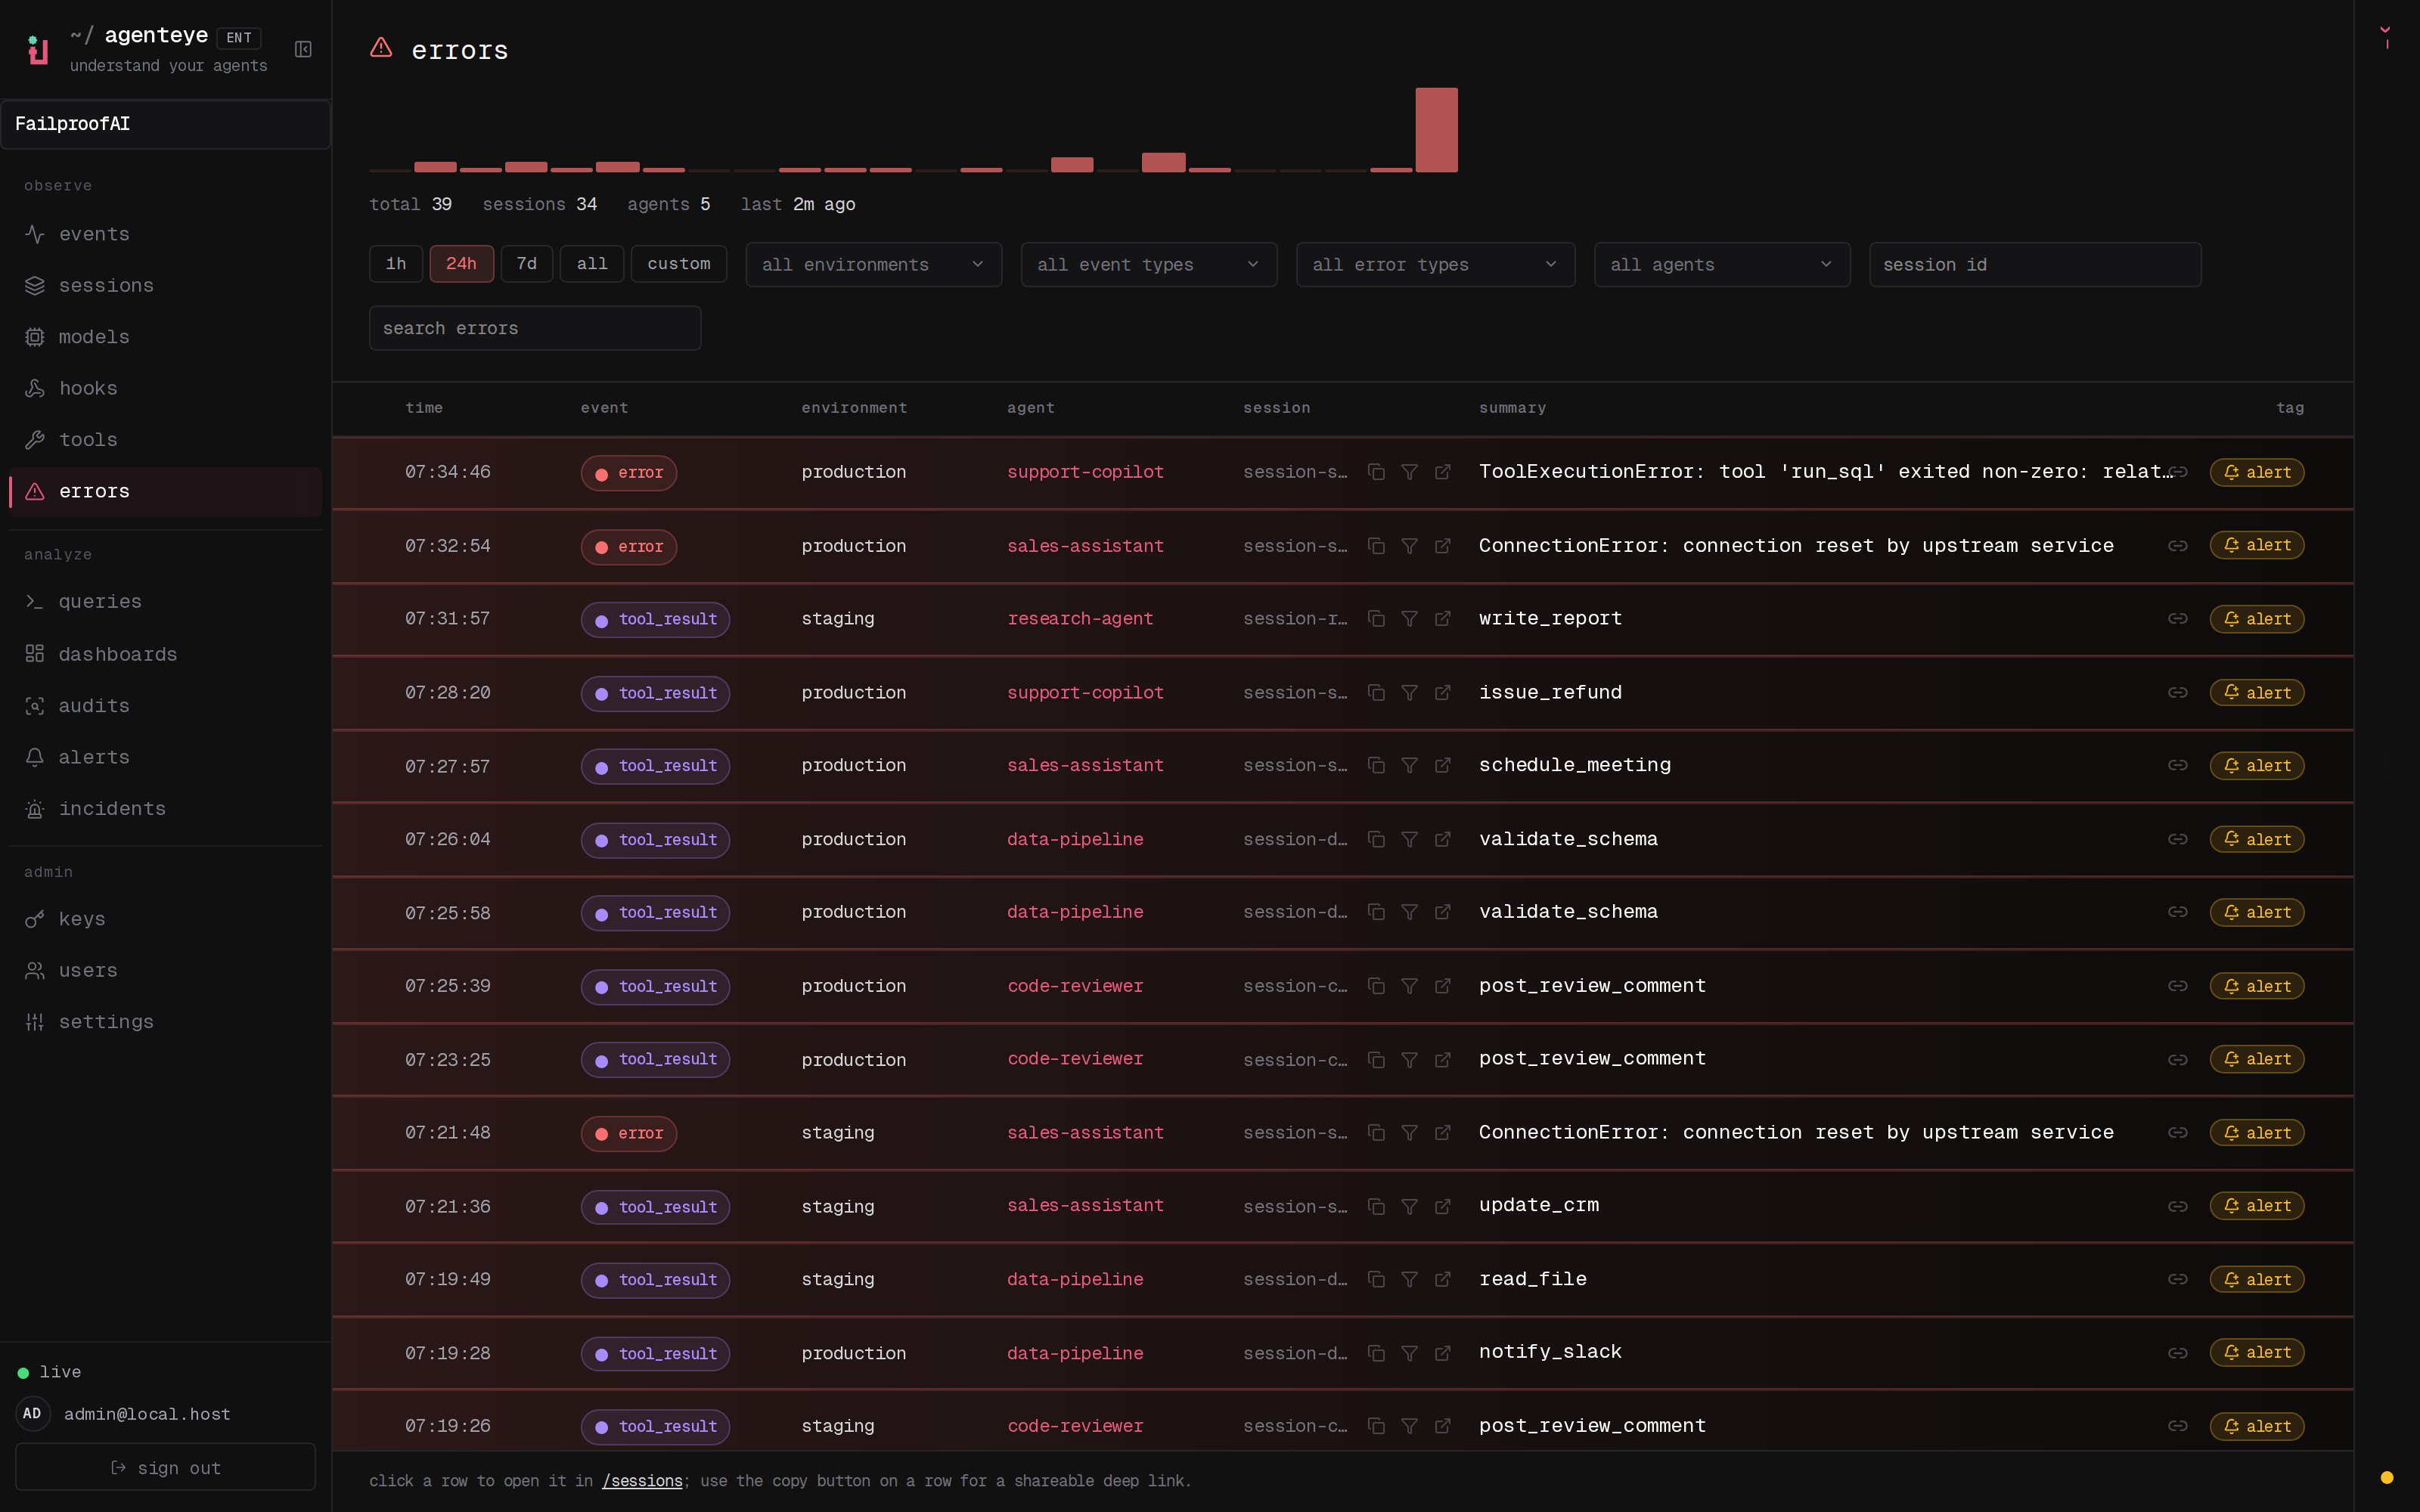 *The Errors page: समय के साथ विफलताओं का एक histogram, repeated failures एक incident के लिए एक row में collapse हो जाती हैं।*
## हर विफलता, पहले से ही आपके लिए collect की गई
जब एक agent टूट जाता है, तो आपको live event stream को scroll करते हुए red rows को catch करने की कोशिश नहीं करनी चाहिए। **Errors** page इसे आपके लिए collect करता है। यह dashboard को red में दिखने वाली हर चीज़ को एक triage surface में pull करता है, ताकि आप पहले देख सकें कि क्या fail हो रहा है, न कि उसे कहां से ढूंढें।
और यह obvious ones से ज्यादा को catch करता है। explicit `error` events के साथ-साथ, FailproofAI Observability quiet failures को भी surface करता है: कोई भी `tool_result`, `hook_completed`, या `agent_end` जिसका payload failure carry करता है, यहां दिखता है। एक tool जो error return करता है, या एक hook जो badly exit करता है, अब आपसे गायब नहीं होता केवल इसलिए कि कोई loud exception नहीं फेंका।
शीर्ष पर, एक histogram समय के साथ errors को plot करता है। एक नज़र से आप बता सकते हैं कि यह एक steady background trickle है या कुछ मिनट पहले शुरू हुआ एक spike, ताकि आप तुरंत जान सकें कि क्या आपको अपना काम रोकना चाहिए।
हर observe surface की तरह, Errors page आपके organization को scoped होता है और date range, environment, agent, और session द्वारा filter होता है। इसका मतलब है कि आप fleet-wide list ले सकते हैं और इसे उस एक agent या एक environment तक narrow कर सकते हैं जिसकी आपको वास्तव में परवाह है।
## एक incident, सौ identical rows नहीं
एक ही broken dependency एक ही error को एक minute में सैकड़ों बार fire कर सकता है। Raw रूप में, यह near-identical lines की एक दीवार है जो उस एक चीज़ को दबा देती है जो आपको वास्तव में देखनी चाहिए।
FailproofAI Observability repeat failures को collapse करता है जो same session और error type share करते हैं एक ही row में। एक burst एक incident के रूप में दिखता है। आप ultimately problems count करते हैं, log lines नहीं, और signal जो matter करता है top पर रहता है बजाय अपने ही volume से दबने के।
## "Something is red" से exact event तक
किसी भी row को click करें और आप सीधे उस run के session में land करते हैं, उस exact event पर positioned जो fail हुआ। कोई session IDs copying नहीं, कोई scrolling नहीं जब की गलत moment को hunt करना हो: आप सीधे इसपर पहुंचते हैं, full execution graph एक glance दूर होता है ताकि आप देख सकें कि agent ने इससे पहले क्या किया जब यह टूटा।
अगर आपके पास `alerts:write` है, तो हर row में एक **+ alert** button भी होता है। इसे click करें और Observability एक नया alert rule खोलता है जो पहले से ही fill हो जाता है उस ही failure को catch करने के लिए। वह incident जिसे आपने अभी triage किया वह बन जाता है जो आपको अगली बार page करेगा, surprise दोबारा देने की जगह।
**यहां खोजें:** **Errors** page dashboard के observe section में होता है, `//errors` पर।
## Related
* [Alerts](/hi/agenteye/alerts): किसी भी failure को एक paging rule में बदलें।
* [Incidents](/hi/agenteye/incidents): एक firing alert को open से resolved तक track करें।
* [Sessions](/hi/agenteye/sessions): किसी भी error के पीछे full run को खोलें।
* [Audits](/hi/agenteye/audits): Observability को अपने runs में failure patterns खोजने दें।
*The Errors page: समय के साथ विफलताओं का एक histogram, repeated failures एक incident के लिए एक row में collapse हो जाती हैं।*
## हर विफलता, पहले से ही आपके लिए collect की गई
जब एक agent टूट जाता है, तो आपको live event stream को scroll करते हुए red rows को catch करने की कोशिश नहीं करनी चाहिए। **Errors** page इसे आपके लिए collect करता है। यह dashboard को red में दिखने वाली हर चीज़ को एक triage surface में pull करता है, ताकि आप पहले देख सकें कि क्या fail हो रहा है, न कि उसे कहां से ढूंढें।
और यह obvious ones से ज्यादा को catch करता है। explicit `error` events के साथ-साथ, FailproofAI Observability quiet failures को भी surface करता है: कोई भी `tool_result`, `hook_completed`, या `agent_end` जिसका payload failure carry करता है, यहां दिखता है। एक tool जो error return करता है, या एक hook जो badly exit करता है, अब आपसे गायब नहीं होता केवल इसलिए कि कोई loud exception नहीं फेंका।
शीर्ष पर, एक histogram समय के साथ errors को plot करता है। एक नज़र से आप बता सकते हैं कि यह एक steady background trickle है या कुछ मिनट पहले शुरू हुआ एक spike, ताकि आप तुरंत जान सकें कि क्या आपको अपना काम रोकना चाहिए।
हर observe surface की तरह, Errors page आपके organization को scoped होता है और date range, environment, agent, और session द्वारा filter होता है। इसका मतलब है कि आप fleet-wide list ले सकते हैं और इसे उस एक agent या एक environment तक narrow कर सकते हैं जिसकी आपको वास्तव में परवाह है।
## एक incident, सौ identical rows नहीं
एक ही broken dependency एक ही error को एक minute में सैकड़ों बार fire कर सकता है। Raw रूप में, यह near-identical lines की एक दीवार है जो उस एक चीज़ को दबा देती है जो आपको वास्तव में देखनी चाहिए।
FailproofAI Observability repeat failures को collapse करता है जो same session और error type share करते हैं एक ही row में। एक burst एक incident के रूप में दिखता है। आप ultimately problems count करते हैं, log lines नहीं, और signal जो matter करता है top पर रहता है बजाय अपने ही volume से दबने के।
## "Something is red" से exact event तक
किसी भी row को click करें और आप सीधे उस run के session में land करते हैं, उस exact event पर positioned जो fail हुआ। कोई session IDs copying नहीं, कोई scrolling नहीं जब की गलत moment को hunt करना हो: आप सीधे इसपर पहुंचते हैं, full execution graph एक glance दूर होता है ताकि आप देख सकें कि agent ने इससे पहले क्या किया जब यह टूटा।
अगर आपके पास `alerts:write` है, तो हर row में एक **+ alert** button भी होता है। इसे click करें और Observability एक नया alert rule खोलता है जो पहले से ही fill हो जाता है उस ही failure को catch करने के लिए। वह incident जिसे आपने अभी triage किया वह बन जाता है जो आपको अगली बार page करेगा, surprise दोबारा देने की जगह।
**यहां खोजें:** **Errors** page dashboard के observe section में होता है, `//errors` पर।
## Related
* [Alerts](/hi/agenteye/alerts): किसी भी failure को एक paging rule में बदलें।
* [Incidents](/hi/agenteye/incidents): एक firing alert को open से resolved तक track करें।
* [Sessions](/hi/agenteye/sessions): किसी भी error के पीछे full run को खोलें।
* [Audits](/hi/agenteye/audits): Observability को अपने runs में failure patterns खोजने दें।