> ## Documentation Index
> Fetch the complete documentation index at: https://docs.befailproof.ai/llms.txt
> Use this file to discover all available pages before exploring further.
# FailproofAI Observability क्या है?
> FailproofAI Observability क्या है? FailproofAI Observability दस्तावेज़।
FailproofAI Observability एक self-hosted प्लेटफॉर्म है जो आपके AI agents को production में observe, evaluate, और improve करने के लिए डिज़ाइन किया गया है। यह आपके agents द्वारा की जाने वाली सभी चीज़ों को record करता है (हर tool call, model request, hook, और error), प्रत्येक run की quality को score करता है, और उन failures को surface करता है जिन्हें आप देखना भूल गए हैं — सब कुछ एक dashboard में जो आप अपने infrastructure के अंदर चलाते हैं।
अगर आप AI agents ship करते हैं और आप अनुमान लगाने से थक गए हैं कि एक run क्यों गलत हुआ, तो यह शुरू करने का सही पेज है। यह बताता है कि FailproofAI Observability आपको क्या देता है और कैसे pieces एक साथ fit करते हैं, कुछ भी install करने से पहले।
> **FailproofAI Observability एक enterprise product है FailproofAI का।** इसे action में देखना चाहते हैं? एक demo request करें: [nikita@befailproof.ai](mailto:nikita@befailproof.ai) को email करें।
*प्रत्येक agent run को git-style execution graph के रूप में drawn किया जाता है (बाएं) इसके event timeline के बगल में। Parallel sub-agents को अपना अपना lane मिलता है; दाएं rail run के लिए tools, models, hooks, और token spend को break down करता है।*
***
## इसे action में देखें
दो छोटे वीडियो दो चीज़ें दिखाते हैं जिन्हें teams सबसे पहले चाहते हैं: एक run को trace करना, और failures को automatically खोजना।
*Agent tracing: एक single run को step by step follow करें, goal से tools से लेकर final answer तक।*
*Failproof Audit: FailproofAI Observability को अपने logs को sessions में mine करने दें और आपको बताएं कि क्या ठीक करना है।*
***
## Teams इसे क्यों use करती हैं
* **देखें कि आपके agent ने actually क्या किया।** प्रत्येक run एक readable, git-style execution graph बन जाता है: कौन से tools parallel में चले, कौन से sub-agents branch off हुए, कहाँ यह stall हुआ, और इसने क्या spend किया।
* **Quality regressions को automatically catch करें।** एक small scoring service को connect करें और FailproofAI Observability प्रत्येक finished run को score करता है, इसलिए helpfulness में एक drop या hallucinations में एक spike अपने आप दिखता है।
* **Failures खोजें जिन्हें आपने rule के लिए नहीं लिखा।** Recurring audits आपके logs को sessions में failure clusters, latency outliers, low scores, और stuck runs के लिए mine करते हैं, फिर आपको ranked, evidence-backed findings देते हैं।
* **जब यह मायने रखे तो page दें।** Threshold rules error rate, latency, cost, या evaluator scores पर fire करते हैं और incidents open करते हैं जिन्हें आप acknowledge, assign, और resolve कर सकते हैं।
* **Plain English में सवाल पूछें।** एक in-dashboard AI assistant आपके own data पर सवालों का जवाब देता है जैसे "इस हफ्ते prod में quality कैसे trend कर रही है?" कोई भी change जो यह करता है वह approval-gated होता है।
* **अपना data रखें।** FailproofAI Observability self-hosted है: events, prompts, और analytics उस infrastructure में रहते हैं जिसे आप control करते हैं।
***
## आपको क्या मिलता है
FailproofAI Observability तीन ideas के चारों ओर organized है (**observe**, **analyze**, और **admin**), जो dashboard के left sidebar में भी दिखते हैं।
**Observe** (जो हुआ उसकी raw truth):
* **[Event stream](/hi/agenteye/event-stream)**: प्रत्येक run का live, per-step trail (tool calls, model calls, hooks, errors)।
* **[Sessions](/hi/agenteye/sessions)**: वे events को one row per run में rolled up किया गया है, प्रत्येक को score के लिए तैयार है, git-style execution graph के साथ।
* **[Performance metrics](/hi/agenteye/telemetry)**: per-surface latency heat-maps और models, tools, और hooks के लिए p50/p95/p99 vitals, ताकि एक tail spike median से अलग दिखे।
* **[Error tracking](/hi/agenteye/error-tracking)**: सब कुछ के लिए एक triage surface जो गलत हुआ, एक firing alert से एक click दूर।
*प्रत्येक observe surface एक sparkline और p50/p95/p99 vitals को एक latency heat-map और एक percentile band के साथ pair करता है। दिखाया गया है: Tools।*
**Analyze** (activity को answers में बदलें):
* **[Queries](/hi/agenteye/queries)** और **[dashboards](/hi/agenteye/dashboards)**: आपके events और evaluations पर saved SQL, shared, org-scoped dashboards में charted।
* **[Evaluations](/hi/agenteye/evaluations)**: आपकी own evaluator service द्वारा उत्पादित quality scores, per-score reasoning के साथ।
* **[Audits](/hi/agenteye/audits)**: recurring investigations जो sessions में failure patterns surface करते हैं।
* **[Alerts](/hi/agenteye/alerts)** और **[incidents](/hi/agenteye/incidents)**: threshold rules जो आपको page करते हैं, plus एक incident workflow उन्हें triage करने के लिए।
**Interfaces** (अपना data अपने तरीके से पहुंचें):
* **[CLI](/hi/agenteye/cli-and-agents)**: terminal से या script से अपनी पूरी deployment को drive करें, और एक coding agent को plain English में इसके लिए करने दें।
* **[AI assistant](/hi/agenteye/assistant)**: dashboard के अंदर ही plain English में अपने agents के बारे में सवाल पूछें।
**Admin** (अपनी team के लिए इसे run करें):
* **[API keys](/hi/agenteye/api-keys)**: collector, dashboard, और assistant के लिए scoped tokens।
* **Users**: passwordless, email-based sign-in एक allowlist के साथ।
* **Settings**: per-org configuration, जिसमें model context-window overrides शामिल हैं।
***
## Pieces कैसे fit करते हैं
Data एक दिशा में बहता है, आपके agent code से dashboard तक: आपका agent (Python SDK के via) events को agenteye-collector में emit करता है, जो उन्हें server को ship करता है, जो dashboard serve करता है। दो optional services इसे round out करते हैं — एक scoring service (evaluations) और एक AI assistant service (in-dashboard chat)।
* **Python SDK**: आप अपने agent में कुछ `agenteye.event.*` calls add करते हैं; events को locally buffer किया जाता है।
* **agenteye-collector**: एक lightweight daemon हर agent machine पर जो events को batch करता है और उन्हें server को ship करता है।
* **Server**: आपके events को ingest करता है और अपने own databases में operational state रखता है।
* **Dashboard**: जहाँ आप सब कुछ explore करते हैं।
* **Optional services**: एक scoring service (evaluations), और एक AI assistant service (in-dashboard chat)।
Docs में उपयोग की जाने वाली vocabulary के लिए (*event, session, evaluation, audit, finding, incident*), [Concepts](/hi/agenteye/concepts) देखें।
***
## FailproofAI Observability प्राप्त करना
FailproofAI Observability एक enterprise product है FailproofAI का, और यह FailproofAI Enforcement के साथ काम करता है — policy और guardrail product — FailproofAI brand के तहत। यह पूरी तरह से आपने own environment में चलता है। अगर आपके पास अभी तक packages तक access नहीं है, तो एक demo request करें और हम आपको set up करेंगे: [nikita@befailproof.ai](mailto:nikita@befailproof.ai) को email करें।
***
## अगली steps
* [Concepts](/hi/agenteye/concepts): FailproofAI Observability vocabulary एक जगह पर।
* [Observability](/hi/agenteye/observability): अपने agents द्वारा जो किया जाए उसे follow करें, run by run।
* [Security](/hi/agenteye/security): कैसे FailproofAI Observability आपके data को isolated रखता है और आपके control में।
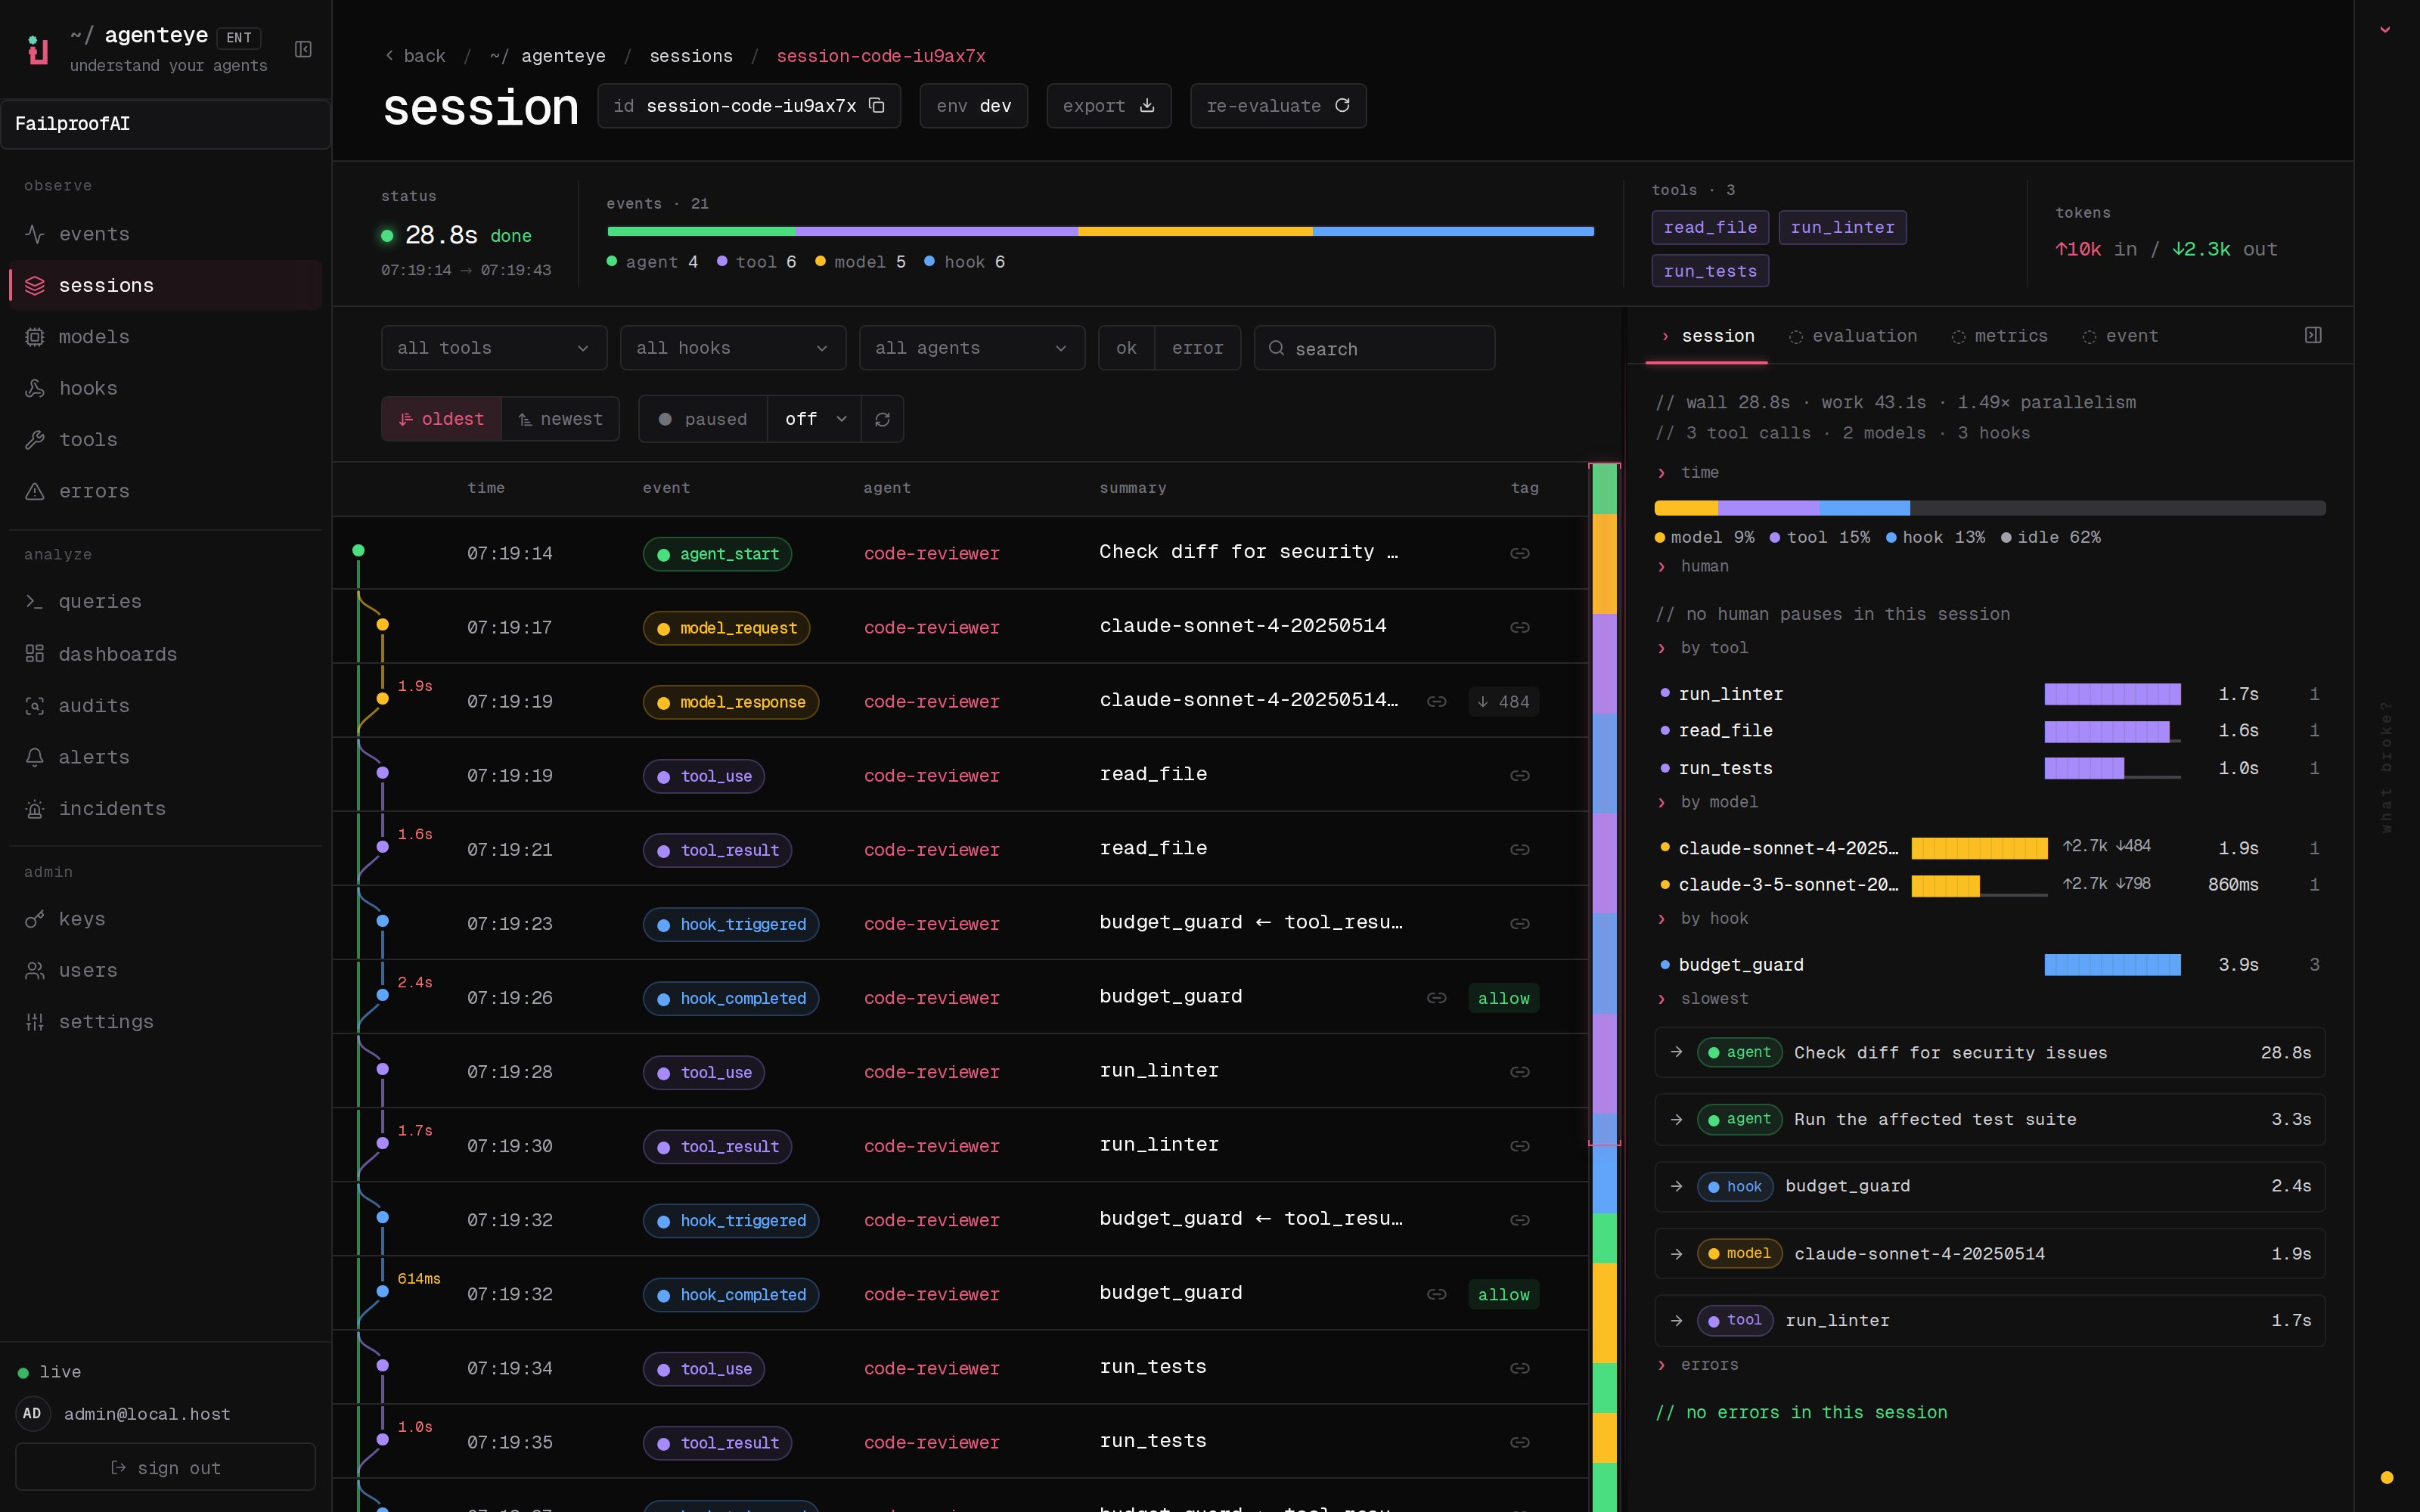 *प्रत्येक agent run को git-style execution graph के रूप में drawn किया जाता है (बाएं) इसके event timeline के बगल में। Parallel sub-agents को अपना अपना lane मिलता है; दाएं rail run के लिए tools, models, hooks, और token spend को break down करता है।*
***
## इसे action में देखें
दो छोटे वीडियो दो चीज़ें दिखाते हैं जिन्हें teams सबसे पहले चाहते हैं: एक run को trace करना, और failures को automatically खोजना।
*प्रत्येक agent run को git-style execution graph के रूप में drawn किया जाता है (बाएं) इसके event timeline के बगल में। Parallel sub-agents को अपना अपना lane मिलता है; दाएं rail run के लिए tools, models, hooks, और token spend को break down करता है।*
***
## इसे action में देखें
दो छोटे वीडियो दो चीज़ें दिखाते हैं जिन्हें teams सबसे पहले चाहते हैं: एक run को trace करना, और failures को automatically खोजना।
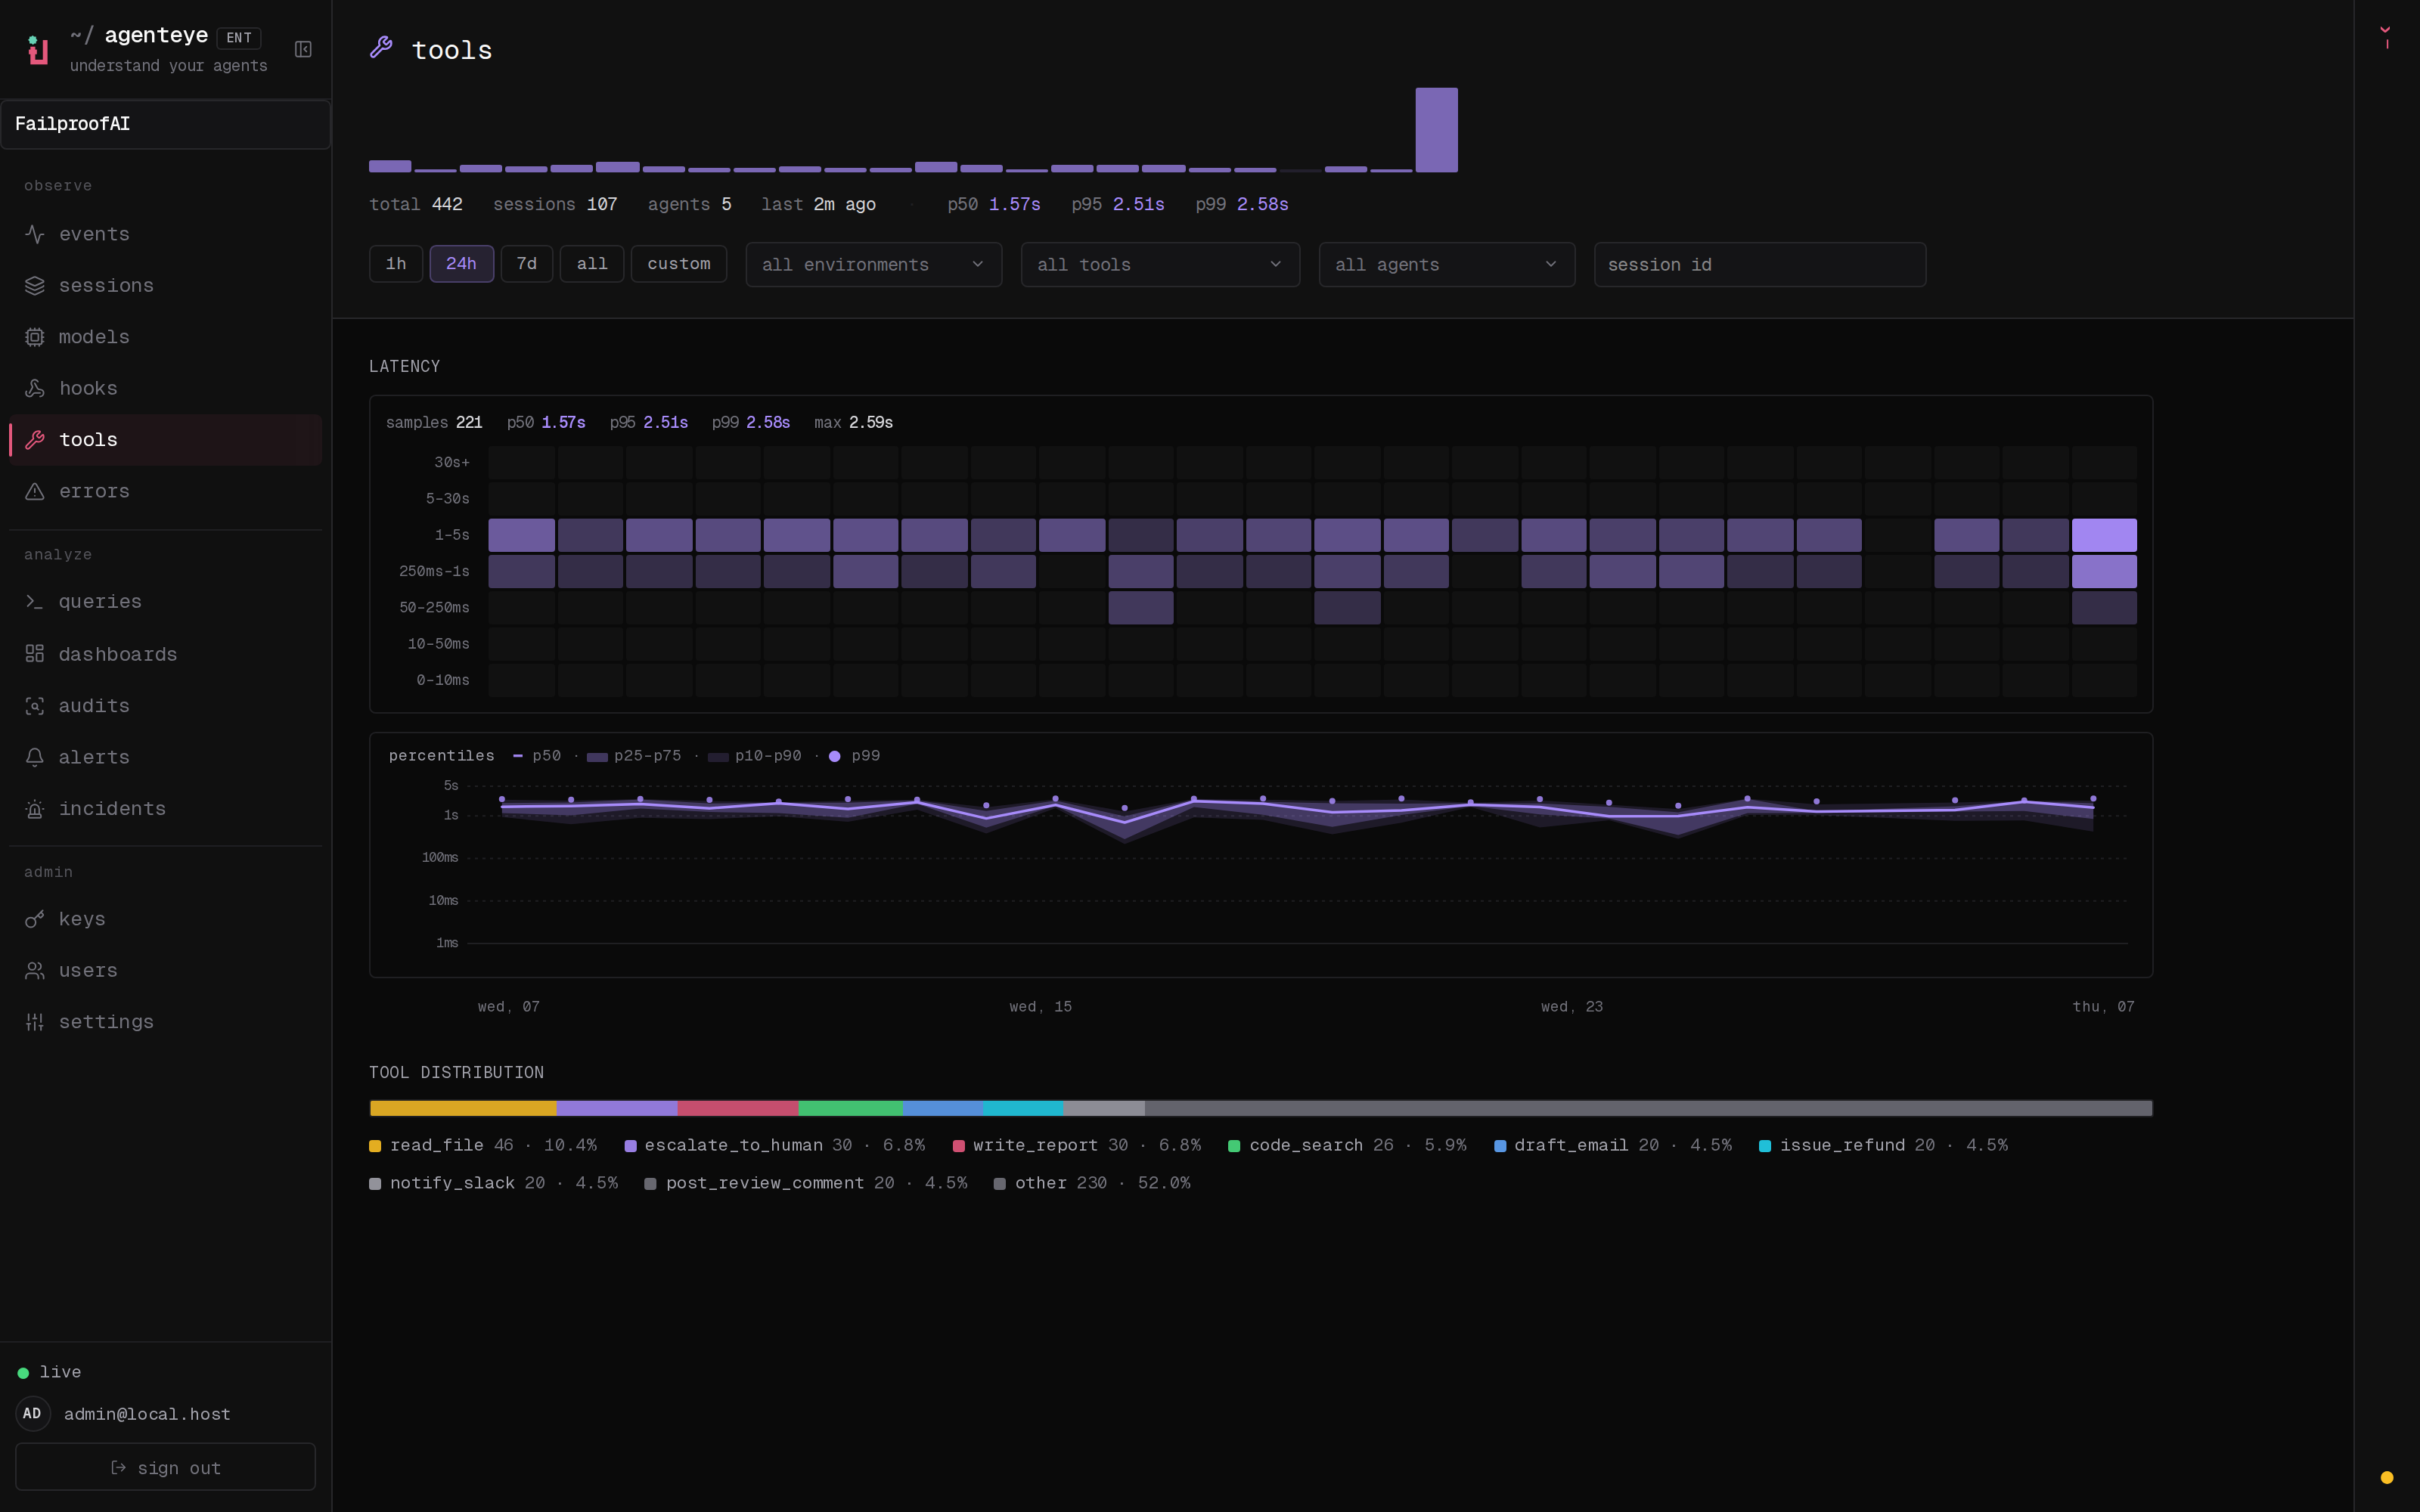 *प्रत्येक observe surface एक sparkline और p50/p95/p99 vitals को एक latency heat-map और एक percentile band के साथ pair करता है। दिखाया गया है: Tools।*
**Analyze** (activity को answers में बदलें):
* **[Queries](/hi/agenteye/queries)** और **[dashboards](/hi/agenteye/dashboards)**: आपके events और evaluations पर saved SQL, shared, org-scoped dashboards में charted।
* **[Evaluations](/hi/agenteye/evaluations)**: आपकी own evaluator service द्वारा उत्पादित quality scores, per-score reasoning के साथ।
* **[Audits](/hi/agenteye/audits)**: recurring investigations जो sessions में failure patterns surface करते हैं।
* **[Alerts](/hi/agenteye/alerts)** और **[incidents](/hi/agenteye/incidents)**: threshold rules जो आपको page करते हैं, plus एक incident workflow उन्हें triage करने के लिए।
**Interfaces** (अपना data अपने तरीके से पहुंचें):
* **[CLI](/hi/agenteye/cli-and-agents)**: terminal से या script से अपनी पूरी deployment को drive करें, और एक coding agent को plain English में इसके लिए करने दें।
* **[AI assistant](/hi/agenteye/assistant)**: dashboard के अंदर ही plain English में अपने agents के बारे में सवाल पूछें।
**Admin** (अपनी team के लिए इसे run करें):
* **[API keys](/hi/agenteye/api-keys)**: collector, dashboard, और assistant के लिए scoped tokens।
* **Users**: passwordless, email-based sign-in एक allowlist के साथ।
* **Settings**: per-org configuration, जिसमें model context-window overrides शामिल हैं।
***
## Pieces कैसे fit करते हैं
Data एक दिशा में बहता है, आपके agent code से dashboard तक: आपका agent (Python SDK के via) events को agenteye-collector में emit करता है, जो उन्हें server को ship करता है, जो dashboard serve करता है। दो optional services इसे round out करते हैं — एक scoring service (evaluations) और एक AI assistant service (in-dashboard chat)।
* **Python SDK**: आप अपने agent में कुछ `agenteye.event.*` calls add करते हैं; events को locally buffer किया जाता है।
* **agenteye-collector**: एक lightweight daemon हर agent machine पर जो events को batch करता है और उन्हें server को ship करता है।
* **Server**: आपके events को ingest करता है और अपने own databases में operational state रखता है।
* **Dashboard**: जहाँ आप सब कुछ explore करते हैं।
* **Optional services**: एक scoring service (evaluations), और एक AI assistant service (in-dashboard chat)।
Docs में उपयोग की जाने वाली vocabulary के लिए (*event, session, evaluation, audit, finding, incident*), [Concepts](/hi/agenteye/concepts) देखें।
***
## FailproofAI Observability प्राप्त करना
FailproofAI Observability एक enterprise product है FailproofAI का, और यह FailproofAI Enforcement के साथ काम करता है — policy और guardrail product — FailproofAI brand के तहत। यह पूरी तरह से आपने own environment में चलता है। अगर आपके पास अभी तक packages तक access नहीं है, तो एक demo request करें और हम आपको set up करेंगे: [nikita@befailproof.ai](mailto:nikita@befailproof.ai) को email करें।
***
## अगली steps
* [Concepts](/hi/agenteye/concepts): FailproofAI Observability vocabulary एक जगह पर।
* [Observability](/hi/agenteye/observability): अपने agents द्वारा जो किया जाए उसे follow करें, run by run।
* [Security](/hi/agenteye/security): कैसे FailproofAI Observability आपके data को isolated रखता है और आपके control में।
*प्रत्येक observe surface एक sparkline और p50/p95/p99 vitals को एक latency heat-map और एक percentile band के साथ pair करता है। दिखाया गया है: Tools।*
**Analyze** (activity को answers में बदलें):
* **[Queries](/hi/agenteye/queries)** और **[dashboards](/hi/agenteye/dashboards)**: आपके events और evaluations पर saved SQL, shared, org-scoped dashboards में charted।
* **[Evaluations](/hi/agenteye/evaluations)**: आपकी own evaluator service द्वारा उत्पादित quality scores, per-score reasoning के साथ।
* **[Audits](/hi/agenteye/audits)**: recurring investigations जो sessions में failure patterns surface करते हैं।
* **[Alerts](/hi/agenteye/alerts)** और **[incidents](/hi/agenteye/incidents)**: threshold rules जो आपको page करते हैं, plus एक incident workflow उन्हें triage करने के लिए।
**Interfaces** (अपना data अपने तरीके से पहुंचें):
* **[CLI](/hi/agenteye/cli-and-agents)**: terminal से या script से अपनी पूरी deployment को drive करें, और एक coding agent को plain English में इसके लिए करने दें।
* **[AI assistant](/hi/agenteye/assistant)**: dashboard के अंदर ही plain English में अपने agents के बारे में सवाल पूछें।
**Admin** (अपनी team के लिए इसे run करें):
* **[API keys](/hi/agenteye/api-keys)**: collector, dashboard, और assistant के लिए scoped tokens।
* **Users**: passwordless, email-based sign-in एक allowlist के साथ।
* **Settings**: per-org configuration, जिसमें model context-window overrides शामिल हैं।
***
## Pieces कैसे fit करते हैं
Data एक दिशा में बहता है, आपके agent code से dashboard तक: आपका agent (Python SDK के via) events को agenteye-collector में emit करता है, जो उन्हें server को ship करता है, जो dashboard serve करता है। दो optional services इसे round out करते हैं — एक scoring service (evaluations) और एक AI assistant service (in-dashboard chat)।
* **Python SDK**: आप अपने agent में कुछ `agenteye.event.*` calls add करते हैं; events को locally buffer किया जाता है।
* **agenteye-collector**: एक lightweight daemon हर agent machine पर जो events को batch करता है और उन्हें server को ship करता है।
* **Server**: आपके events को ingest करता है और अपने own databases में operational state रखता है।
* **Dashboard**: जहाँ आप सब कुछ explore करते हैं।
* **Optional services**: एक scoring service (evaluations), और एक AI assistant service (in-dashboard chat)।
Docs में उपयोग की जाने वाली vocabulary के लिए (*event, session, evaluation, audit, finding, incident*), [Concepts](/hi/agenteye/concepts) देखें।
***
## FailproofAI Observability प्राप्त करना
FailproofAI Observability एक enterprise product है FailproofAI का, और यह FailproofAI Enforcement के साथ काम करता है — policy और guardrail product — FailproofAI brand के तहत। यह पूरी तरह से आपने own environment में चलता है। अगर आपके पास अभी तक packages तक access नहीं है, तो एक demo request करें और हम आपको set up करेंगे: [nikita@befailproof.ai](mailto:nikita@befailproof.ai) को email करें।
***
## अगली steps
* [Concepts](/hi/agenteye/concepts): FailproofAI Observability vocabulary एक जगह पर।
* [Observability](/hi/agenteye/observability): अपने agents द्वारा जो किया जाए उसे follow करें, run by run।
* [Security](/hi/agenteye/security): कैसे FailproofAI Observability आपके data को isolated रखता है और आपके control में।