> ## Documentation Index
> Fetch the complete documentation index at: https://docs.befailproof.ai/llms.txt
> Use this file to discover all available pages before exploring further.
# Performance Metrics
> FailproofAI Observability Performance Metrics documentation.
देखें कि आपके मॉडल, टूल्स, या हुक्स कब धीमे हो जाते हैं या बिल बढ़ाते हैं, और अपने उपयोगकर्ताओं को महसूस होने से पहले टेल-लेटेंसी स्पाइक को पकड़ें। तीन समर्पित पृष्ठ raw timings को p50, p95, और p99 में बदलते हैं जिन्हें आप एक नज़र में पढ़ सकते हैं।
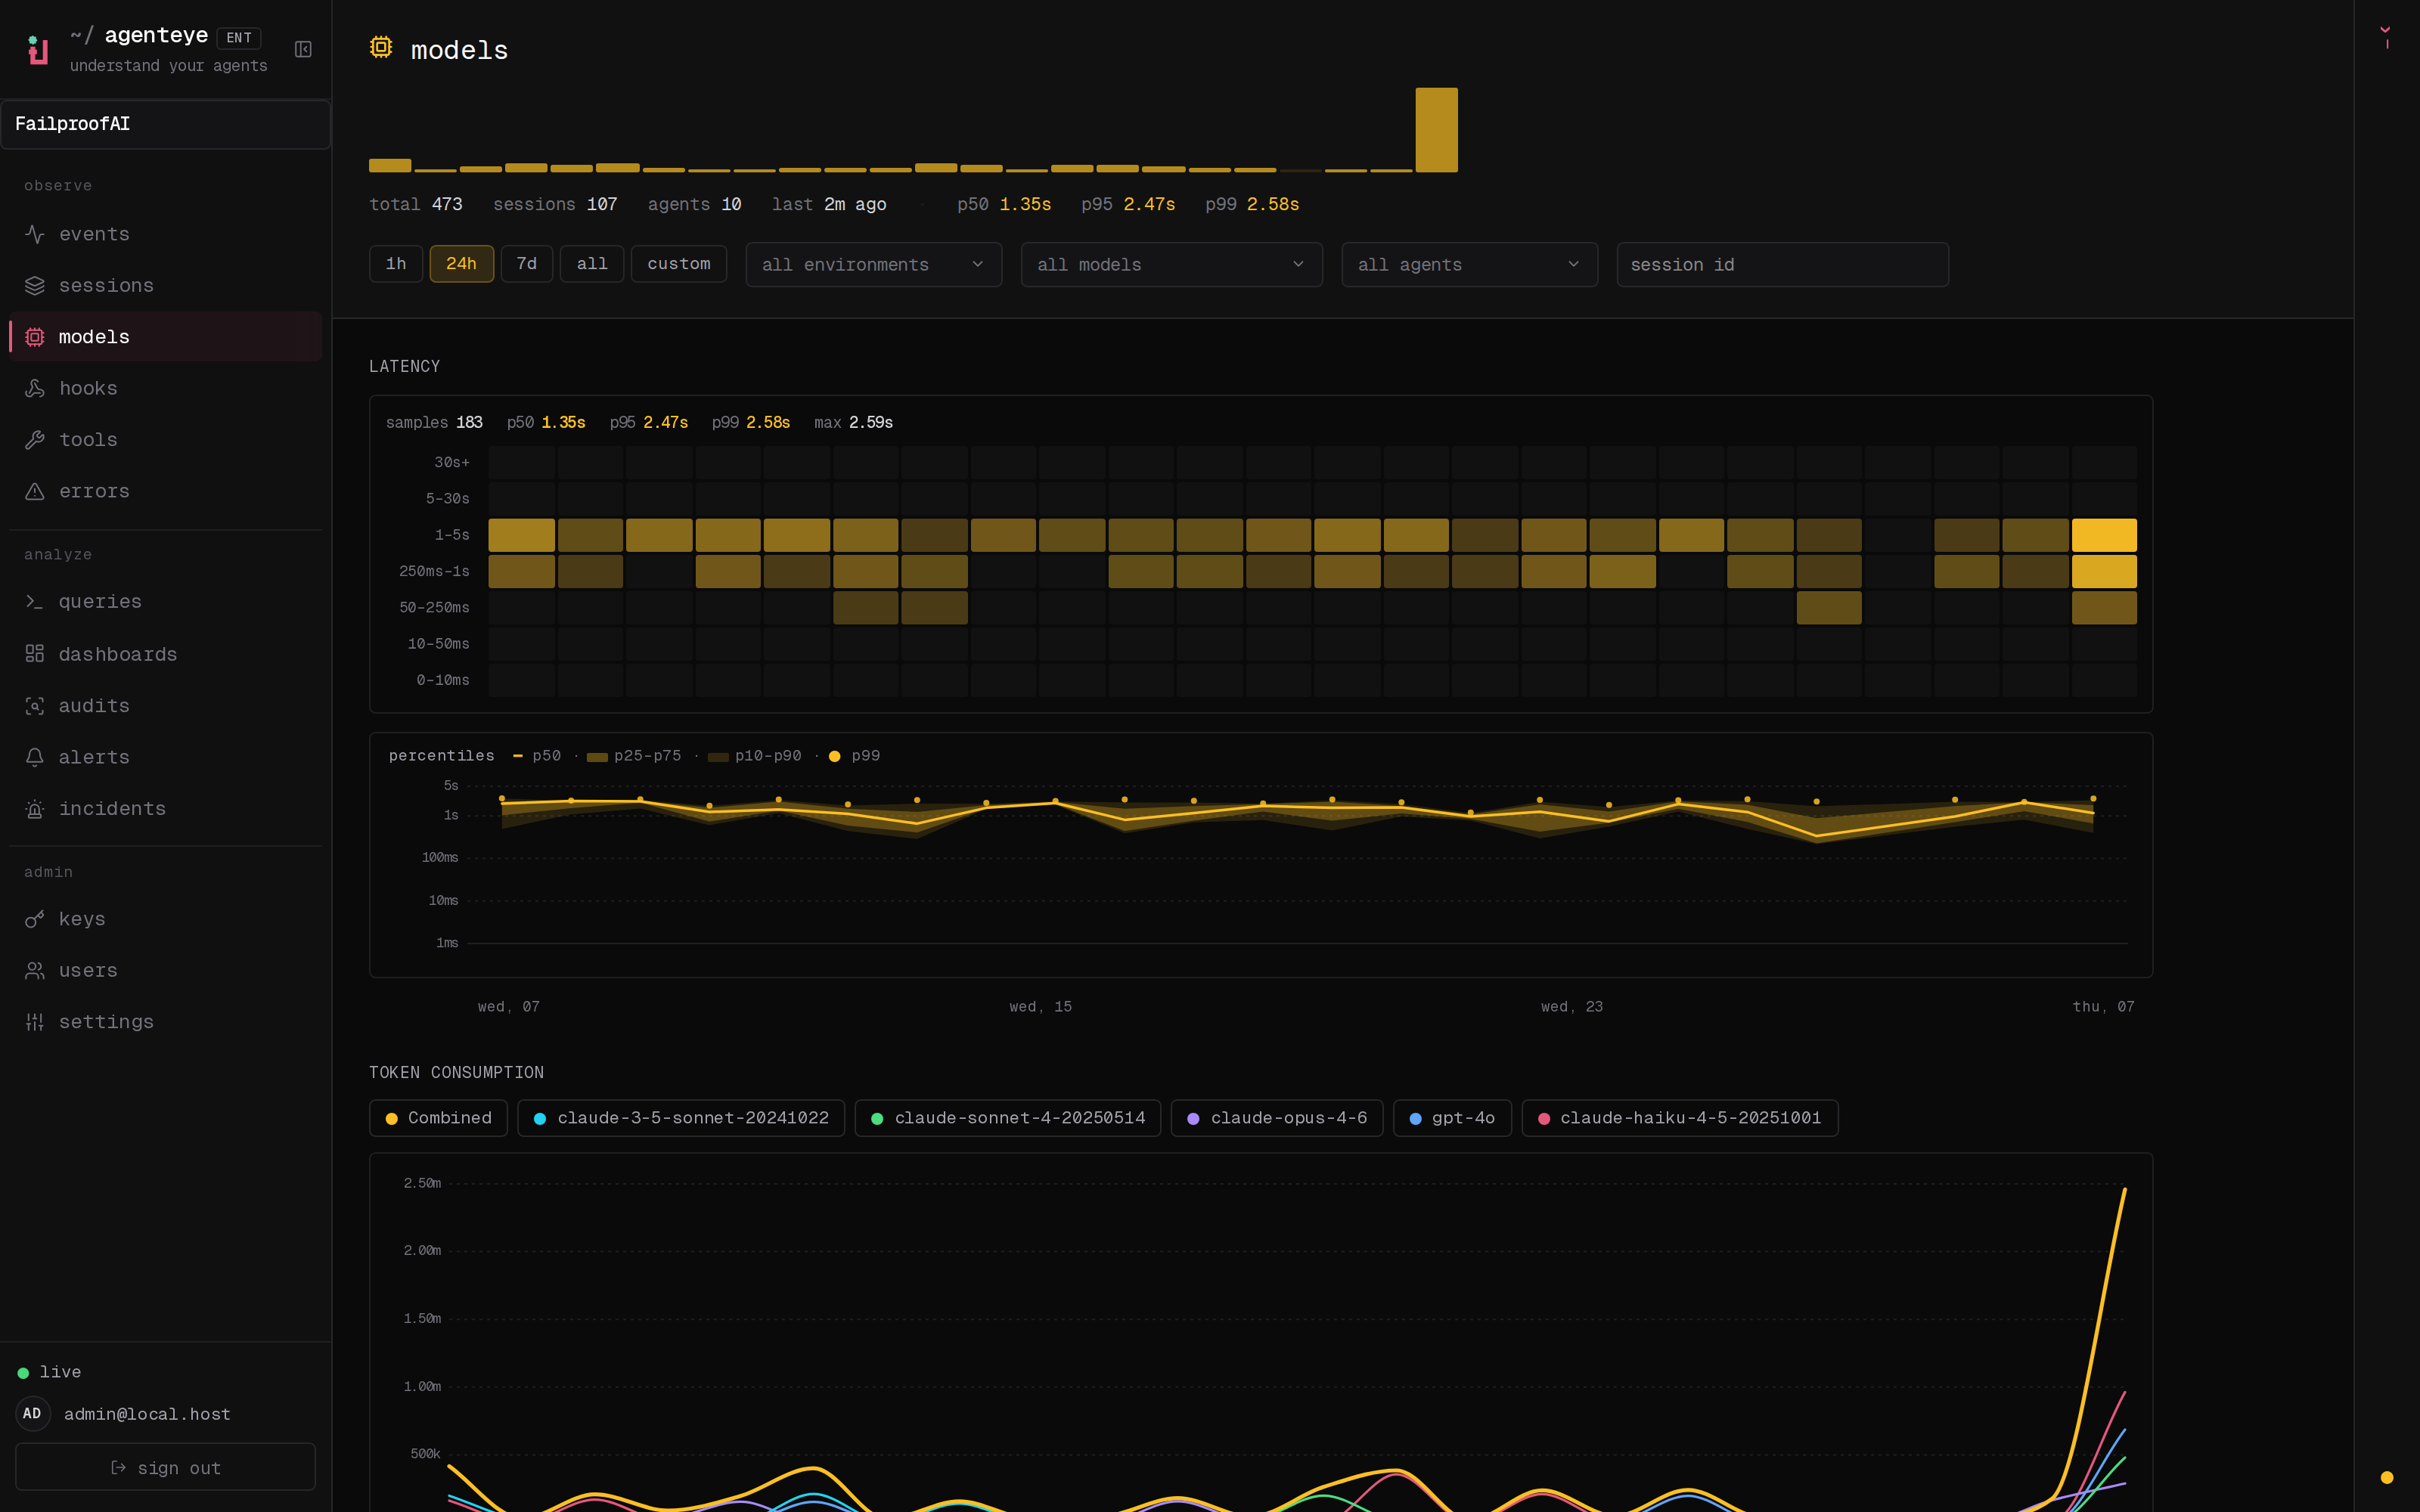 *Models पृष्ठ: एक latency heat-map, एक percentile band, और प्रति-मॉडल tokens, अनुमानित cost, और context-window fill।*
## औसत को अपने सबसे बुरे runs को छिपाने दें
औसत latency संख्या सुकून देने वाली और बेकार है: यह उस एक कॉल को चिकना कर देती है जो पचास में से एक में रुक जाती है और रात 2 बजे आपके on-call को जगाती है। Models, Tools, और Hooks पृष्ठ ऐसा करने से इनकार करते हैं। प्रत्येक एक ही आकृति साझा करता है, इसलिए आप इसे एक बार सीखते हैं:
* एक **24-bin sparkline** एक नज़र में trend के लिए: क्या यह बदतर हो रहा है?
* एक **vitals strip** p50, p95, और p99 latency के साथ, इसलिए typical run और tail एक-दूसरे के बगल में हैं।
* एक **latency heat-map**, 24 time bins द्वारा latency buckets, जो दिखाता है *कब* slow calls क्लस्टर हुए।
* एक **percentile band**: एक p50 line with p25 to p75 और p10 to p90 shaded ribbons और p99 dots, इसलिए spread दिखाई देता है औसत से छिपाया नहीं जा सकता।
एक साझा hover crosshair heat-map और band को जोड़ता है, इसलिए एक tail spike समय में दोनों में संरेखित होता है बजाय एक single mean line के पीछे छिपने के। अपने dashboard के **observe** सेक्शन में सभी तीन पृष्ठ खोजें, प्रत्येक अपने organization के लिए scoped और date range, environment, agent, और session द्वारा filterable।
## Models: देखें कि प्रत्येक मॉडल आपको ठीक कितना खर्च करता है
Models पृष्ठ (ऊपर दिखाया गया है) दो सवालों के जवाब देता है जो bill हमेशा उठाता है: कौन सा model, और कितना। shared latency view के ऊपर, यह **per-model token consumption**, **estimated cost**, और **context-window fill** जोड़ता है, इसलिए runaway prompt growth और impending compaction दिखाई देते हैं इससे पहले कि वे आपको आश्चर्यचकित करें।
FailproofAI Observability सामान्य model IDs को automatically पहचानता है। यदि एक window गलत दिखता है, या आप अपना निजी मॉडल चलाते हैं, तो इसे **Settings** में, **model context windows** में सही करें या जोड़ें, और fill readouts अनुसरण करते हैं।
## Tools: slow को broken से अलग करें
एक tool call धीमा हो सकता है, या यह quietly fail हो सकता है, और आप जानना चाहते हैं कि यह कौन सा है सेकंड में, लॉग के माध्यम से खोदने के बाद नहीं।
*Models पृष्ठ: एक latency heat-map, एक percentile band, और प्रति-मॉडल tokens, अनुमानित cost, और context-window fill।*
## औसत को अपने सबसे बुरे runs को छिपाने दें
औसत latency संख्या सुकून देने वाली और बेकार है: यह उस एक कॉल को चिकना कर देती है जो पचास में से एक में रुक जाती है और रात 2 बजे आपके on-call को जगाती है। Models, Tools, और Hooks पृष्ठ ऐसा करने से इनकार करते हैं। प्रत्येक एक ही आकृति साझा करता है, इसलिए आप इसे एक बार सीखते हैं:
* एक **24-bin sparkline** एक नज़र में trend के लिए: क्या यह बदतर हो रहा है?
* एक **vitals strip** p50, p95, और p99 latency के साथ, इसलिए typical run और tail एक-दूसरे के बगल में हैं।
* एक **latency heat-map**, 24 time bins द्वारा latency buckets, जो दिखाता है *कब* slow calls क्लस्टर हुए।
* एक **percentile band**: एक p50 line with p25 to p75 और p10 to p90 shaded ribbons और p99 dots, इसलिए spread दिखाई देता है औसत से छिपाया नहीं जा सकता।
एक साझा hover crosshair heat-map और band को जोड़ता है, इसलिए एक tail spike समय में दोनों में संरेखित होता है बजाय एक single mean line के पीछे छिपने के। अपने dashboard के **observe** सेक्शन में सभी तीन पृष्ठ खोजें, प्रत्येक अपने organization के लिए scoped और date range, environment, agent, और session द्वारा filterable।
## Models: देखें कि प्रत्येक मॉडल आपको ठीक कितना खर्च करता है
Models पृष्ठ (ऊपर दिखाया गया है) दो सवालों के जवाब देता है जो bill हमेशा उठाता है: कौन सा model, और कितना। shared latency view के ऊपर, यह **per-model token consumption**, **estimated cost**, और **context-window fill** जोड़ता है, इसलिए runaway prompt growth और impending compaction दिखाई देते हैं इससे पहले कि वे आपको आश्चर्यचकित करें।
FailproofAI Observability सामान्य model IDs को automatically पहचानता है। यदि एक window गलत दिखता है, या आप अपना निजी मॉडल चलाते हैं, तो इसे **Settings** में, **model context windows** में सही करें या जोड़ें, और fill readouts अनुसरण करते हैं।
## Tools: slow को broken से अलग करें
एक tool call धीमा हो सकता है, या यह quietly fail हो सकता है, और आप जानना चाहते हैं कि यह कौन सा है सेकंड में, लॉग के माध्यम से खोदने के बाद नहीं।
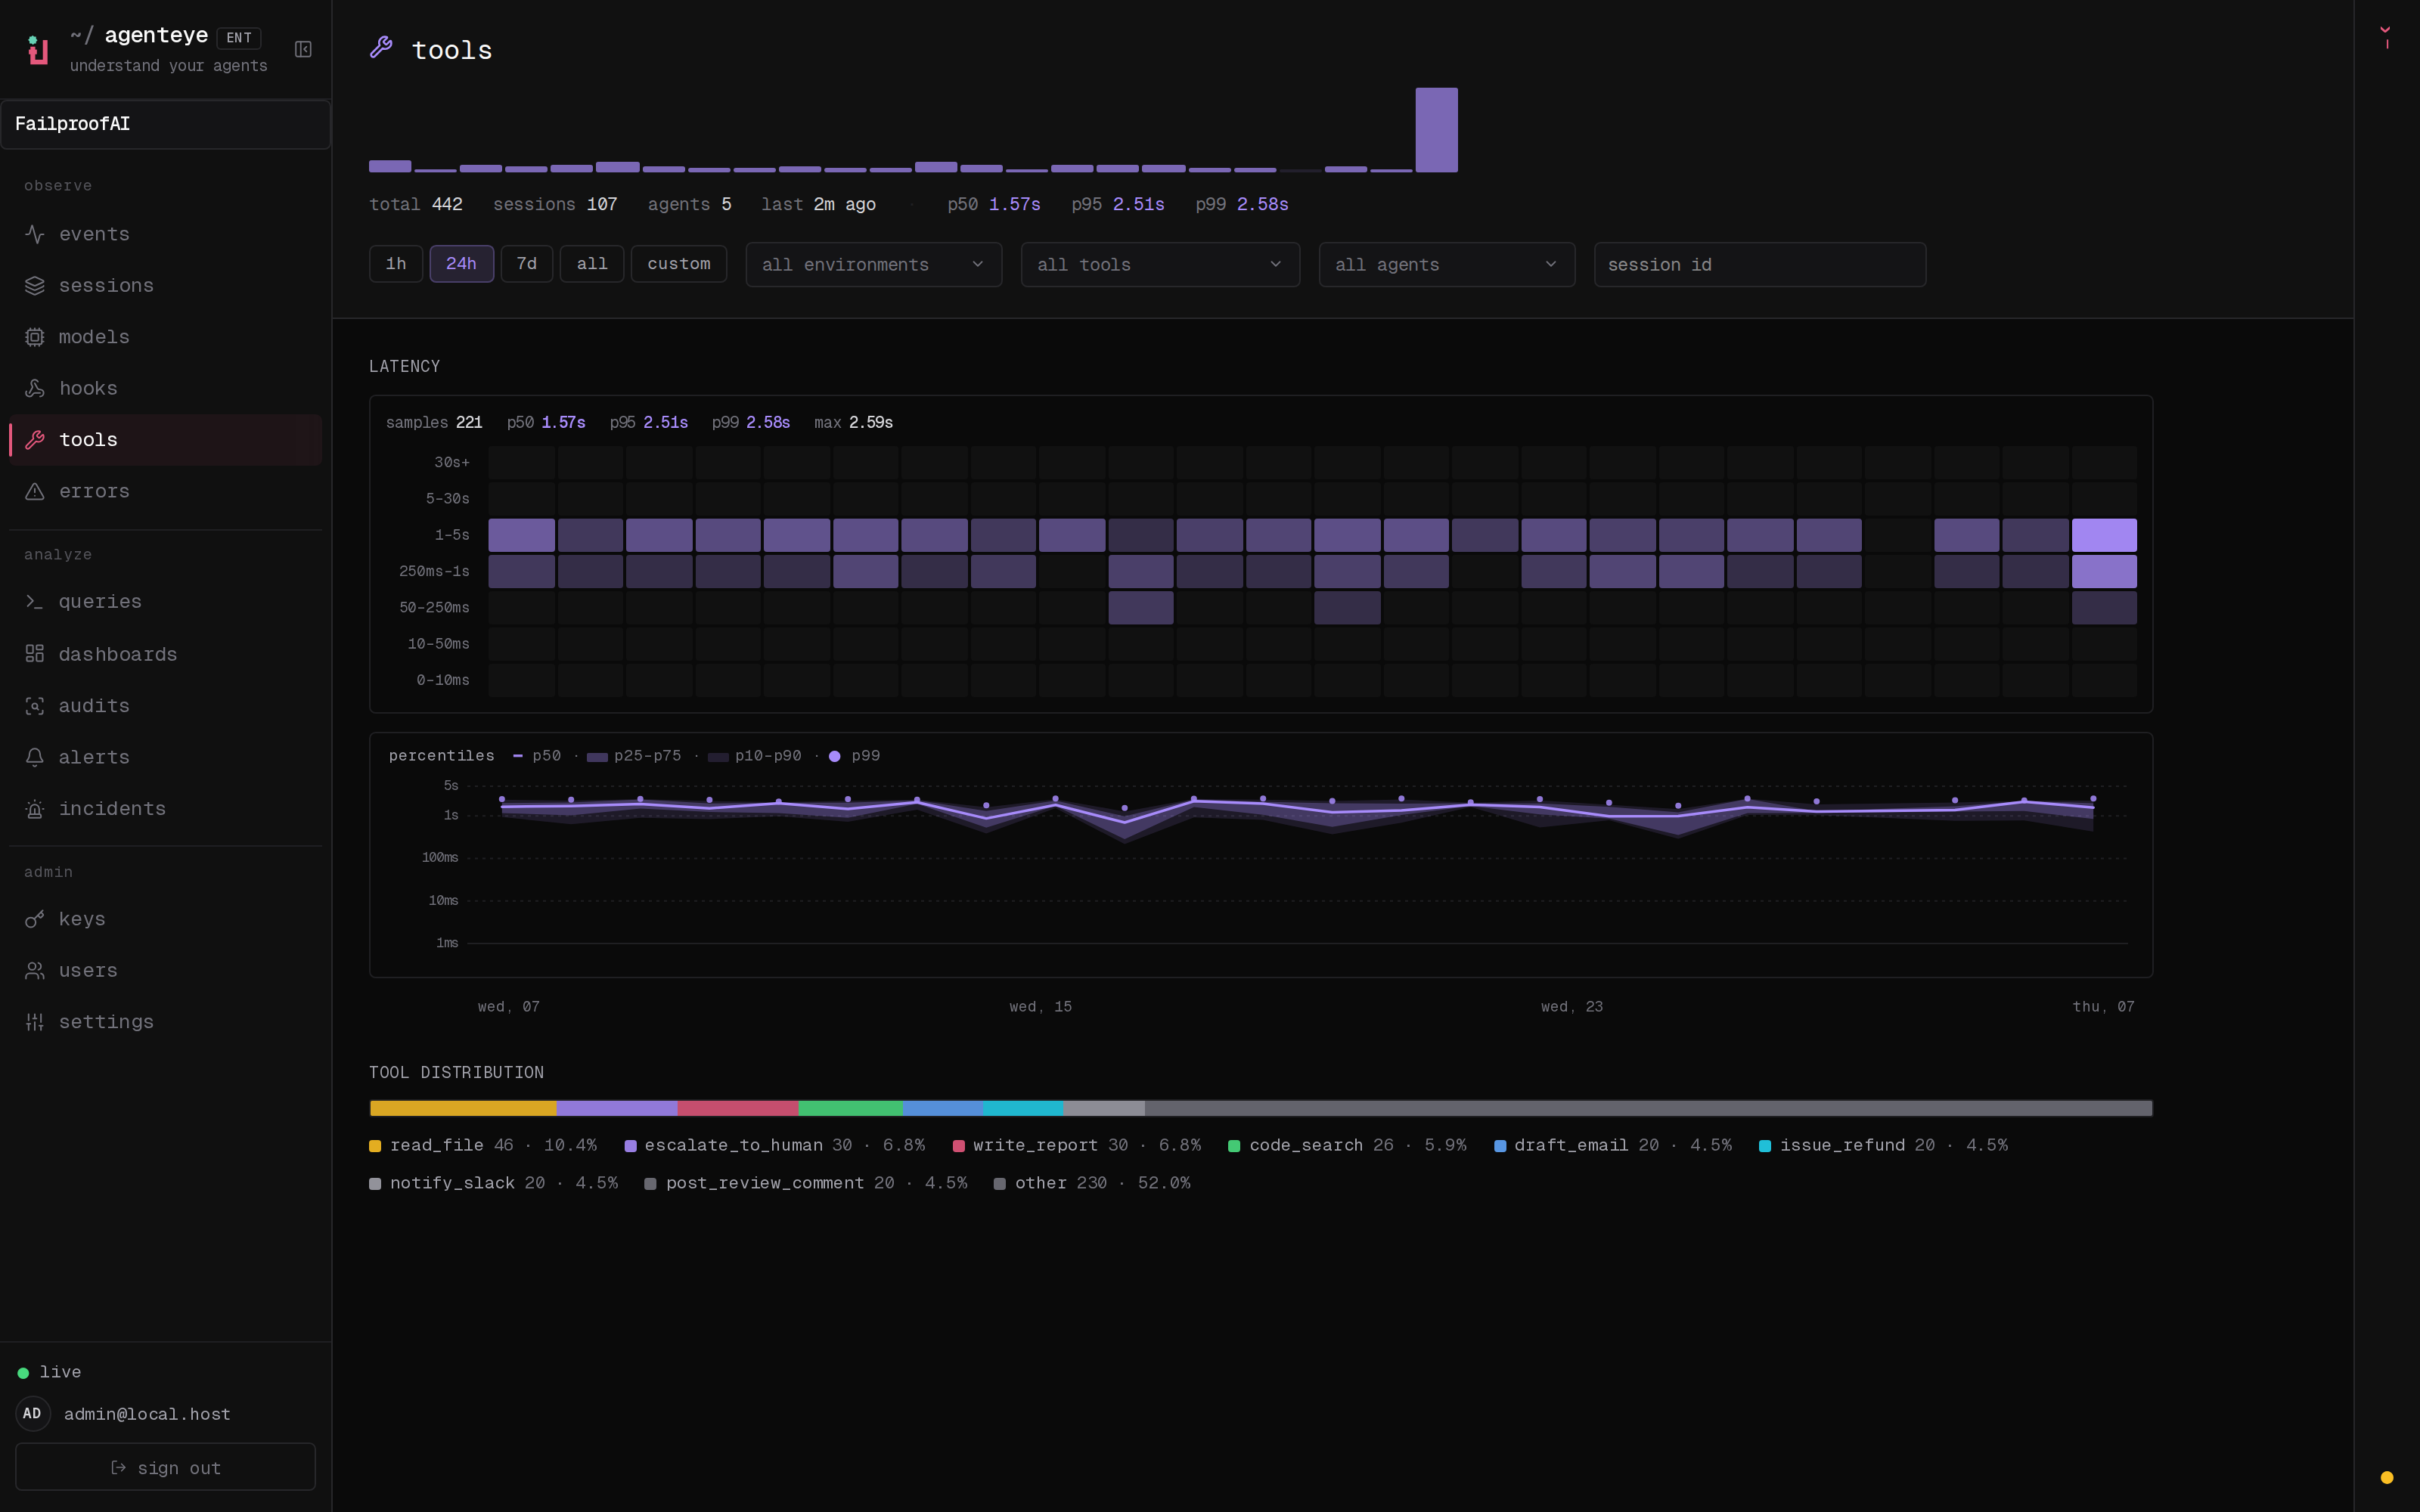 *Tools पृष्ठ: same heat-map और percentile band, plus एक success और failure breakdown और एक tool-distribution bar।*
shared latency view के साथ-साथ, Tools पृष्ठ एक **success and failure breakdown** और एक **tool-distribution bar** जोड़ता है, इसलिए आप एक नज़र में देखते हैं कि आप कौन से tools पर सबसे अधिक निर्भर हैं और कौन से आपके error budget को खा रहे हैं।
## Hooks: सटीक hook और trigger को pinpoint करें
जब एक lifecycle hook एक run को drag करता है, "hooks धीमे हैं" कुछ ऐसा नहीं है जिस पर आप कार्रवाई कर सकते हैं। Hooks पृष्ठ आपको उस पर ले जाता है जो मायने रखता है।
*Tools पृष्ठ: same heat-map और percentile band, plus एक success और failure breakdown और एक tool-distribution bar।*
shared latency view के साथ-साथ, Tools पृष्ठ एक **success and failure breakdown** और एक **tool-distribution bar** जोड़ता है, इसलिए आप एक नज़र में देखते हैं कि आप कौन से tools पर सबसे अधिक निर्भर हैं और कौन से आपके error budget को खा रहे हैं।
## Hooks: सटीक hook और trigger को pinpoint करें
जब एक lifecycle hook एक run को drag करता है, "hooks धीमे हैं" कुछ ऐसा नहीं है जिस पर आप कार्रवाई कर सकते हैं। Hooks पृष्ठ आपको उस पर ले जाता है जो मायने रखता है।
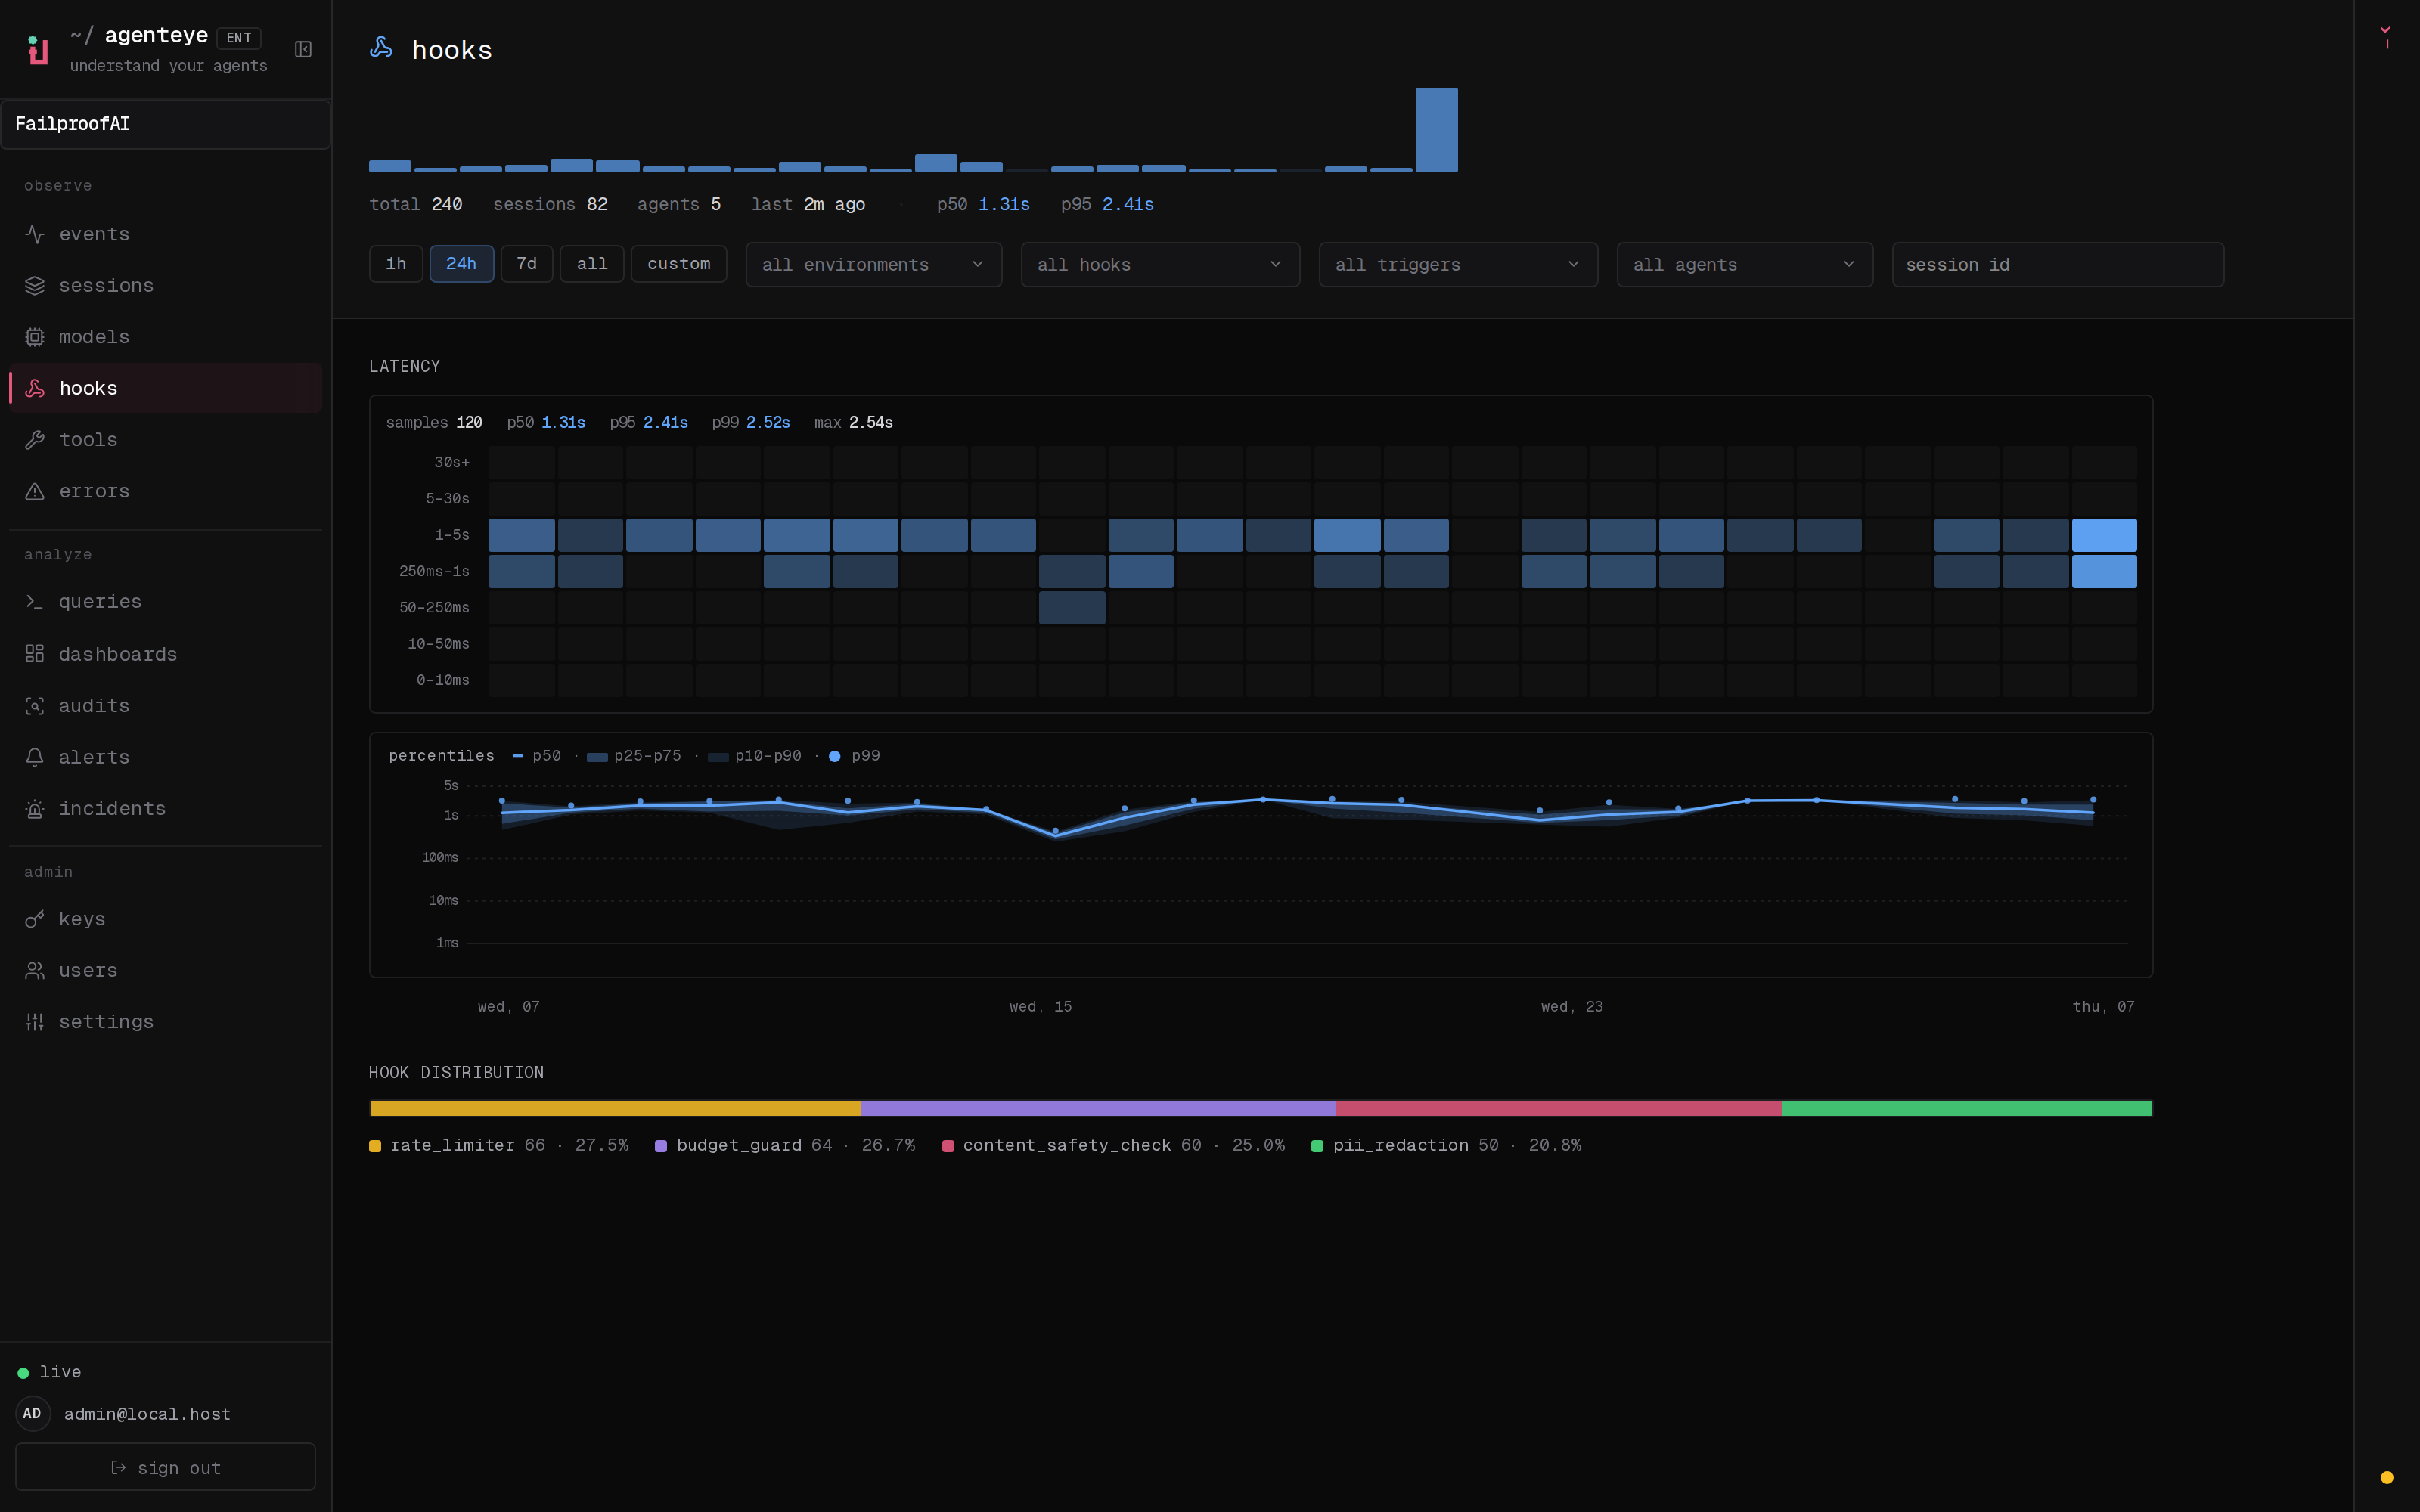 *Hooks पृष्ठ: latency को hook name और trigger event द्वारा broken down किया गया।*
same latency heat-map और percentile band के ऊपर, Hooks पृष्ठ activity को **hook name** और **trigger event** द्वारा break down करता है, इसलिए आप single hook और single event पर उतरते हैं जिन्हें ध्यान देने की आवश्यकता है।
## Related
* [Event stream](/hi/agenteye/event-stream): हर event का live, colour-coded trail।
* [Sessions](/hi/agenteye/sessions): events को एक row प्रति run में roll up करें और इसके execution graph को खोलें।
* [Error tracking](/hi/agenteye/error-tracking): dashboard सभी कुछ को red में पेंट करने के लिए एक triage surface।
* [Dashboards](/hi/agenteye/dashboards): अपने fleet में roll-up views।
*Hooks पृष्ठ: latency को hook name और trigger event द्वारा broken down किया गया।*
same latency heat-map और percentile band के ऊपर, Hooks पृष्ठ activity को **hook name** और **trigger event** द्वारा break down करता है, इसलिए आप single hook और single event पर उतरते हैं जिन्हें ध्यान देने की आवश्यकता है।
## Related
* [Event stream](/hi/agenteye/event-stream): हर event का live, colour-coded trail।
* [Sessions](/hi/agenteye/sessions): events को एक row प्रति run में roll up करें और इसके execution graph को खोलें।
* [Error tracking](/hi/agenteye/error-tracking): dashboard सभी कुछ को red में पेंट करने के लिए एक triage surface।
* [Dashboards](/hi/agenteye/dashboards): अपने fleet में roll-up views।