> ## Documentation Index
> Fetch the complete documentation index at: https://docs.befailproof.ai/llms.txt
> Use this file to discover all available pages before exploring further.
# Sessions
> Start with the complete record of one agent run.
A session is the best starting point when an agent behaves unexpectedly. It joins the model requests, responses, tool calls, human interactions, errors, evaluations, and policy decisions that belong to one run.
Follow one agent run from its goal through model calls, tools, and final response.
## Find a session
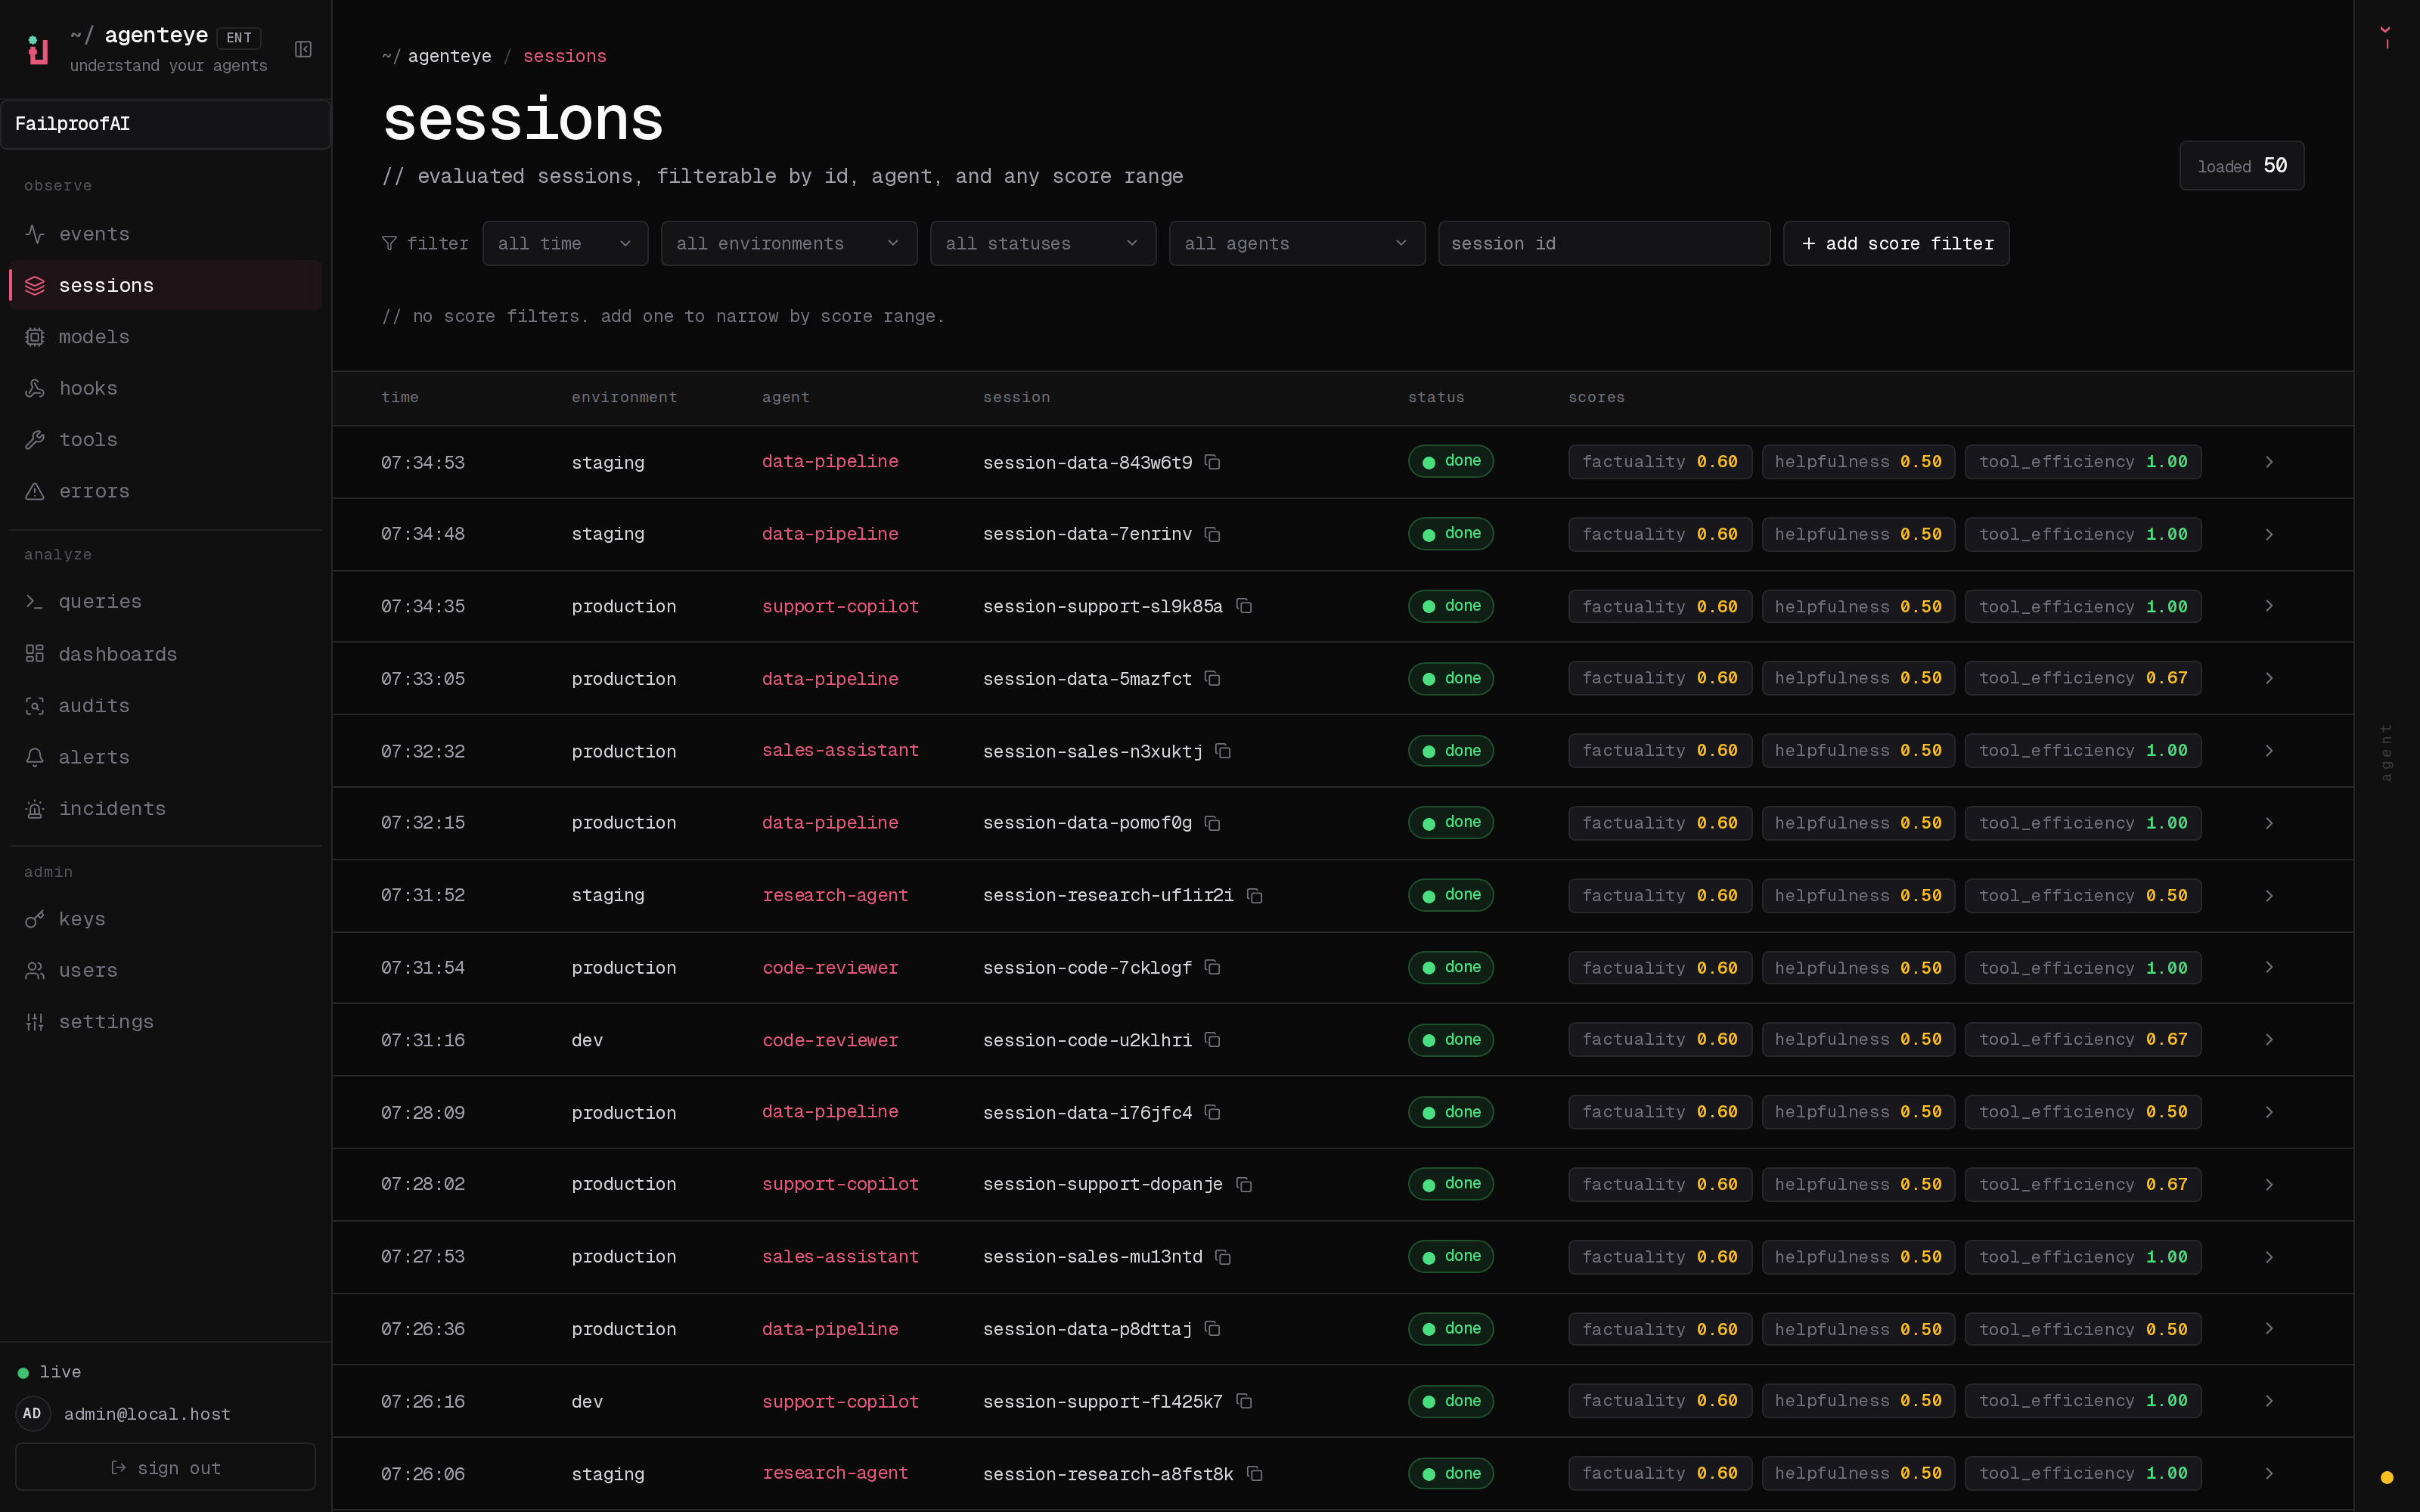
1. In the Cloud sidebar, go to **Observe → Sessions**.
2. Set the time window, then filter by environment, status, agent, or session ID.
3. Add score or metric ranges when you need a quality, cost, token, or latency slice.
4. Select a row to open its trace. Use the copy control beside the session ID when sharing it.
```bash theme={null}
fp sessions --env production --since 24h
fp sessions --status error,timeout --agent-id checkout-agent
fp --json sessions --session-id
```
Add `--agents` to expand multi-agent runs, `--all` to paginate, or `--fields` to choose output columns.
## What you can do
* Find a run by agent, environment, time, model, event type, or error state.
* Follow the exact sequence that produced an outcome.
* Compare successful and failed runs.
* Open the evidence used by an audit finding or alert incident.
* Export a session when you need an offline record.
## A reliable investigation order
1. Confirm the session goal and environment.
2. Find the first error or unexpected decision—not only the final failure.
3. Inspect the model context and tool input immediately before it.
4. Check retries, latency, and human interruptions.
5. Review evaluation scores and policy decisions.
Learn how to move from the session summary to the event that caused the outcome.