> ## Documentation Index
> Fetch the complete documentation index at: https://docs.befailproof.ai/llms.txt
> Use this file to discover all available pages before exploring further.
# Read a trace
> Find the event that changed the course of an agent session.
A trace turns a flat event stream into the causal story of the run. Read it from the first divergence, not backward from the last error.
## Open the trace
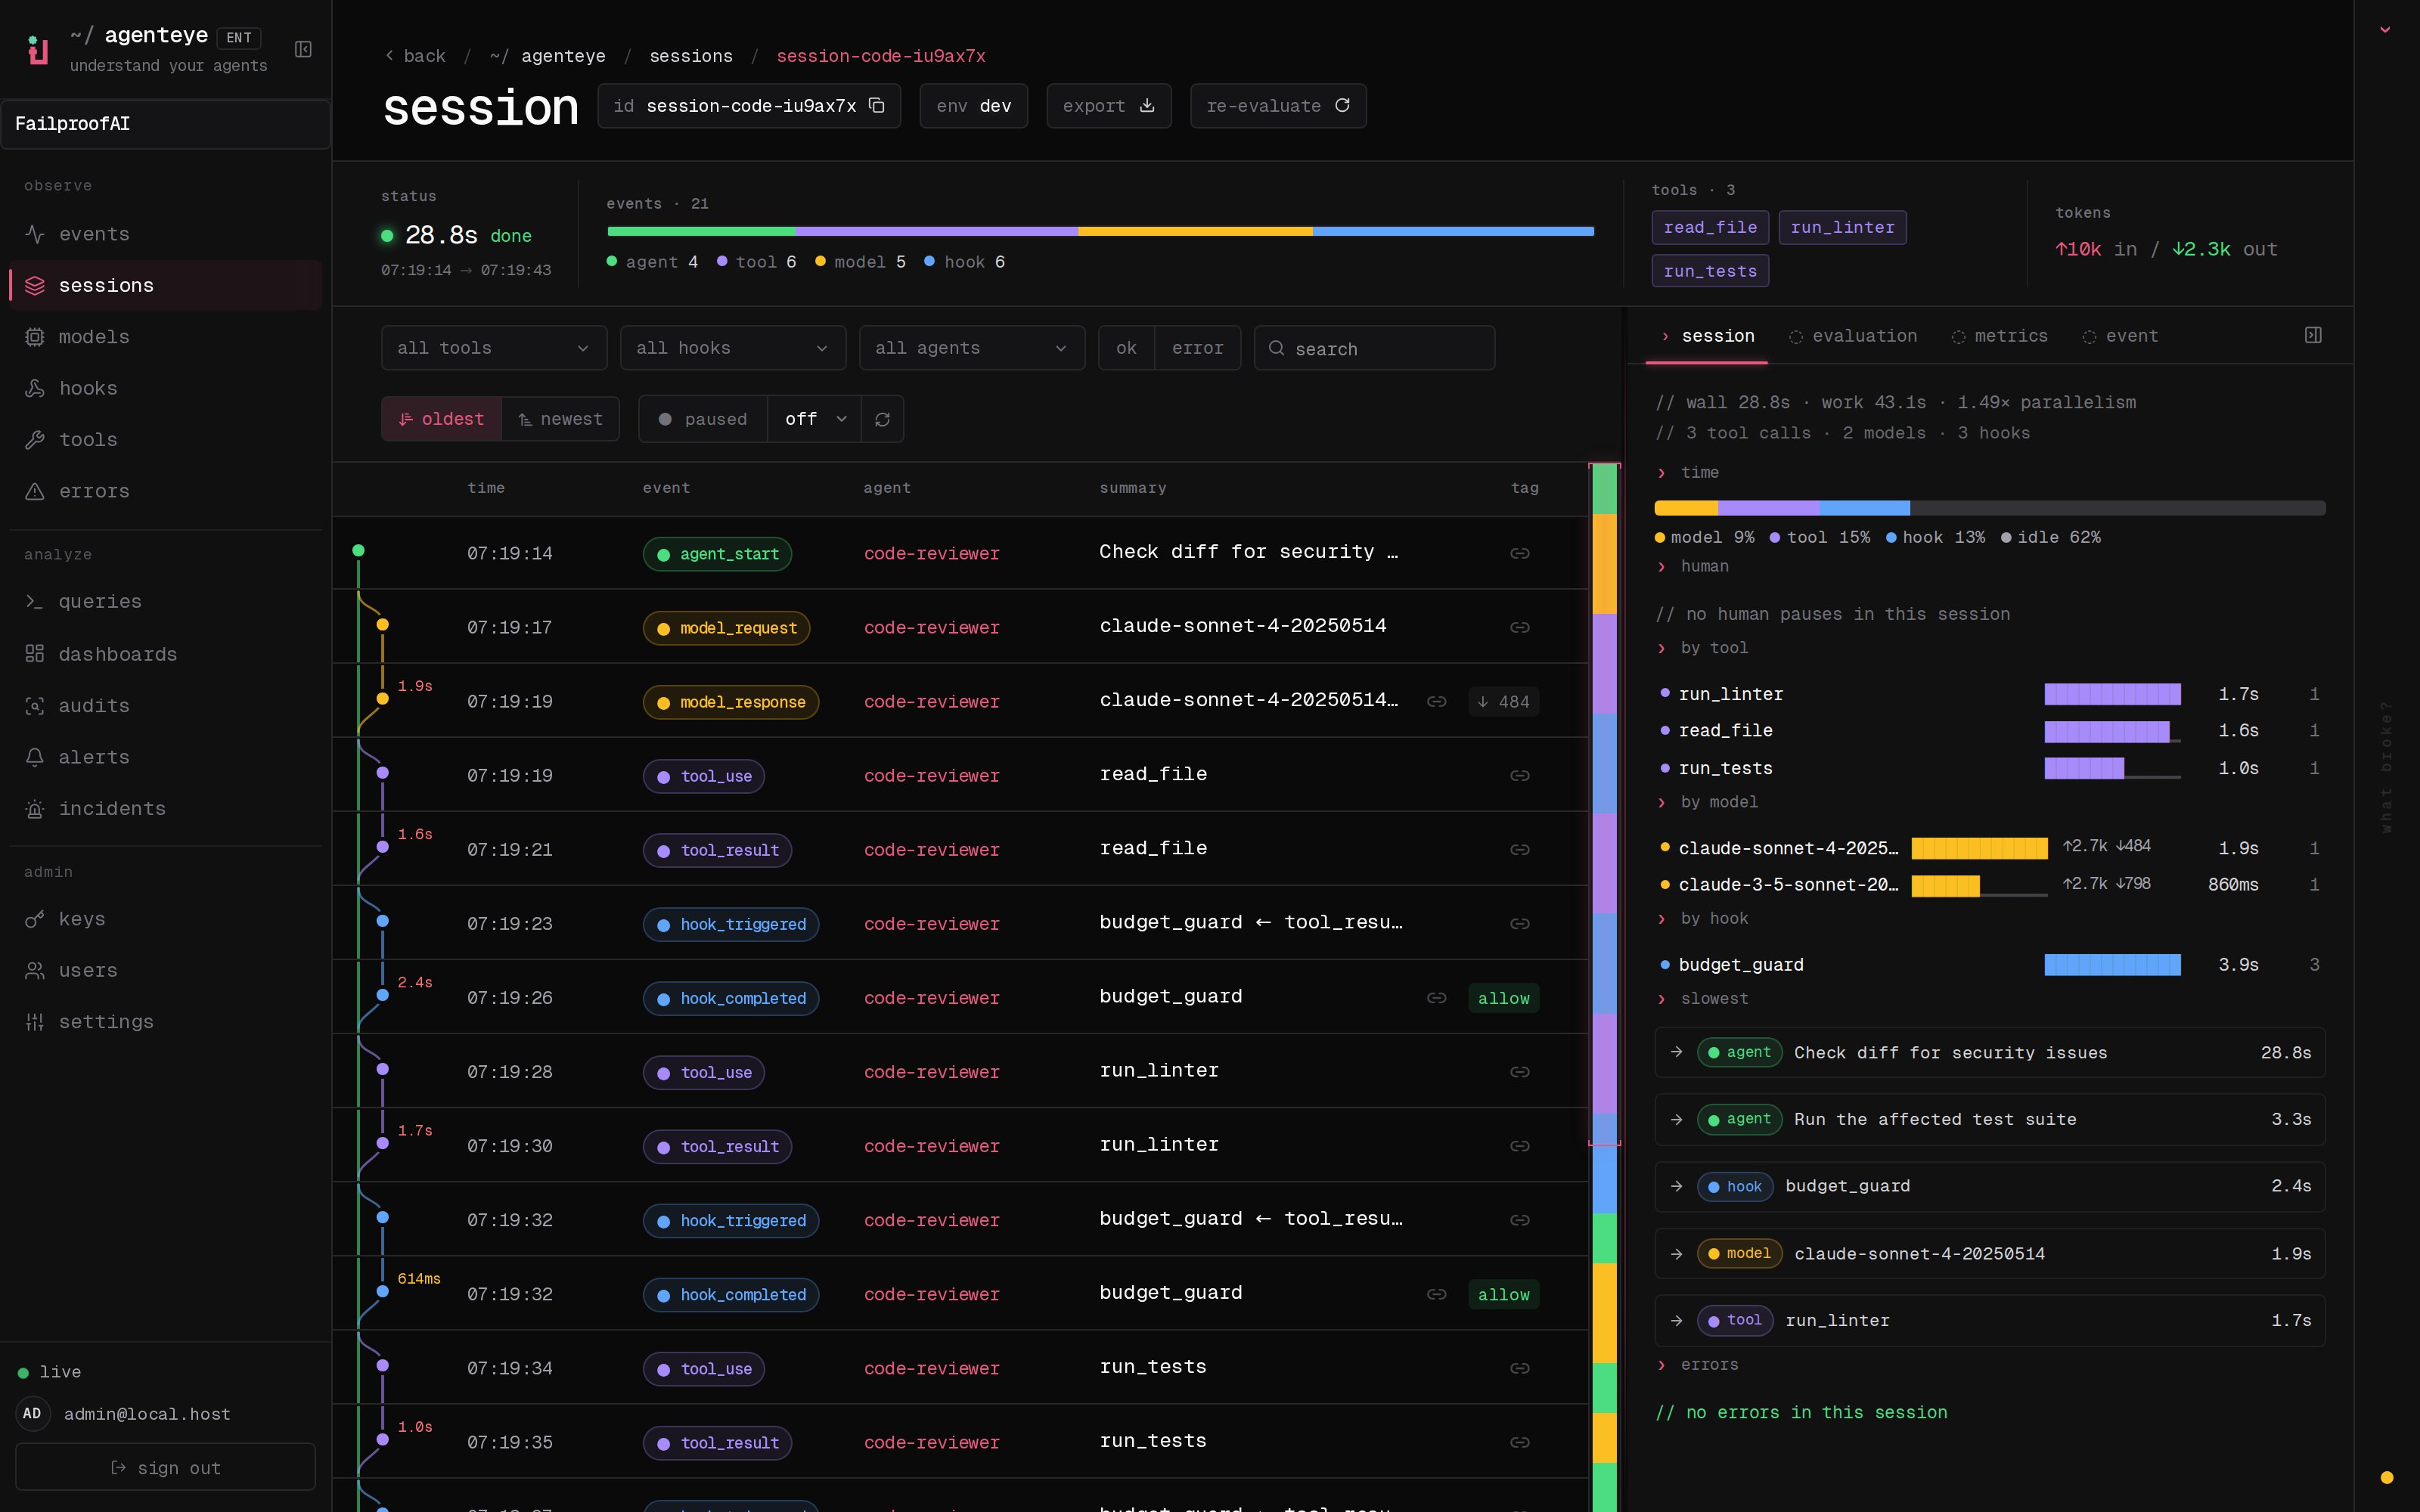
1. Go to **Observe → Sessions** and open a session.
2. Use the profile summary to check outcome, timing, errors, and evaluation scores.
3. Scan the timeline and minimap. Filter event types or time when the session is large.
4. Select an event to inspect it. Use **export** for evaluator JSON, or copy the page URL to share a deep link to the selected evidence.
 ```bash theme={null}
fp --json sessions --session-id
fp events --session-id --order asc --all
fp --json events --full --session-id --all
```
Use the light event feed first. Request full payloads only when the event summaries do not contain enough evidence.
Confirm the agent, environment, timing, outcome, and duration, then scan for errors, long spans, repeated tools, human waits, and denied policy decisions.
Inspect its request, response, tool input, output, and correlation ID. Sensitive content is visible only when transcript capture is enabled and your permissions allow it.
The cause often sits one event earlier: an incorrect model response, missing tool result, or stale assumption.
Add the session to an audit scope, link it to an issue, or use the failure mode to author a policy.
Long duration does not always mean model latency. Separate model, tool, hook, and human-wait time before deciding what to fix.
```bash theme={null}
fp --json sessions --session-id
fp events --session-id --order asc --all
fp --json events --full --session-id --all
```
Use the light event feed first. Request full payloads only when the event summaries do not contain enough evidence.
Confirm the agent, environment, timing, outcome, and duration, then scan for errors, long spans, repeated tools, human waits, and denied policy decisions.
Inspect its request, response, tool input, output, and correlation ID. Sensitive content is visible only when transcript capture is enabled and your permissions allow it.
The cause often sits one event earlier: an incorrect model response, missing tool result, or stale assumption.
Add the session to an audit scope, link it to an issue, or use the failure mode to author a policy.
Long duration does not always mean model latency. Separate model, tool, hook, and human-wait time before deciding what to fix.