

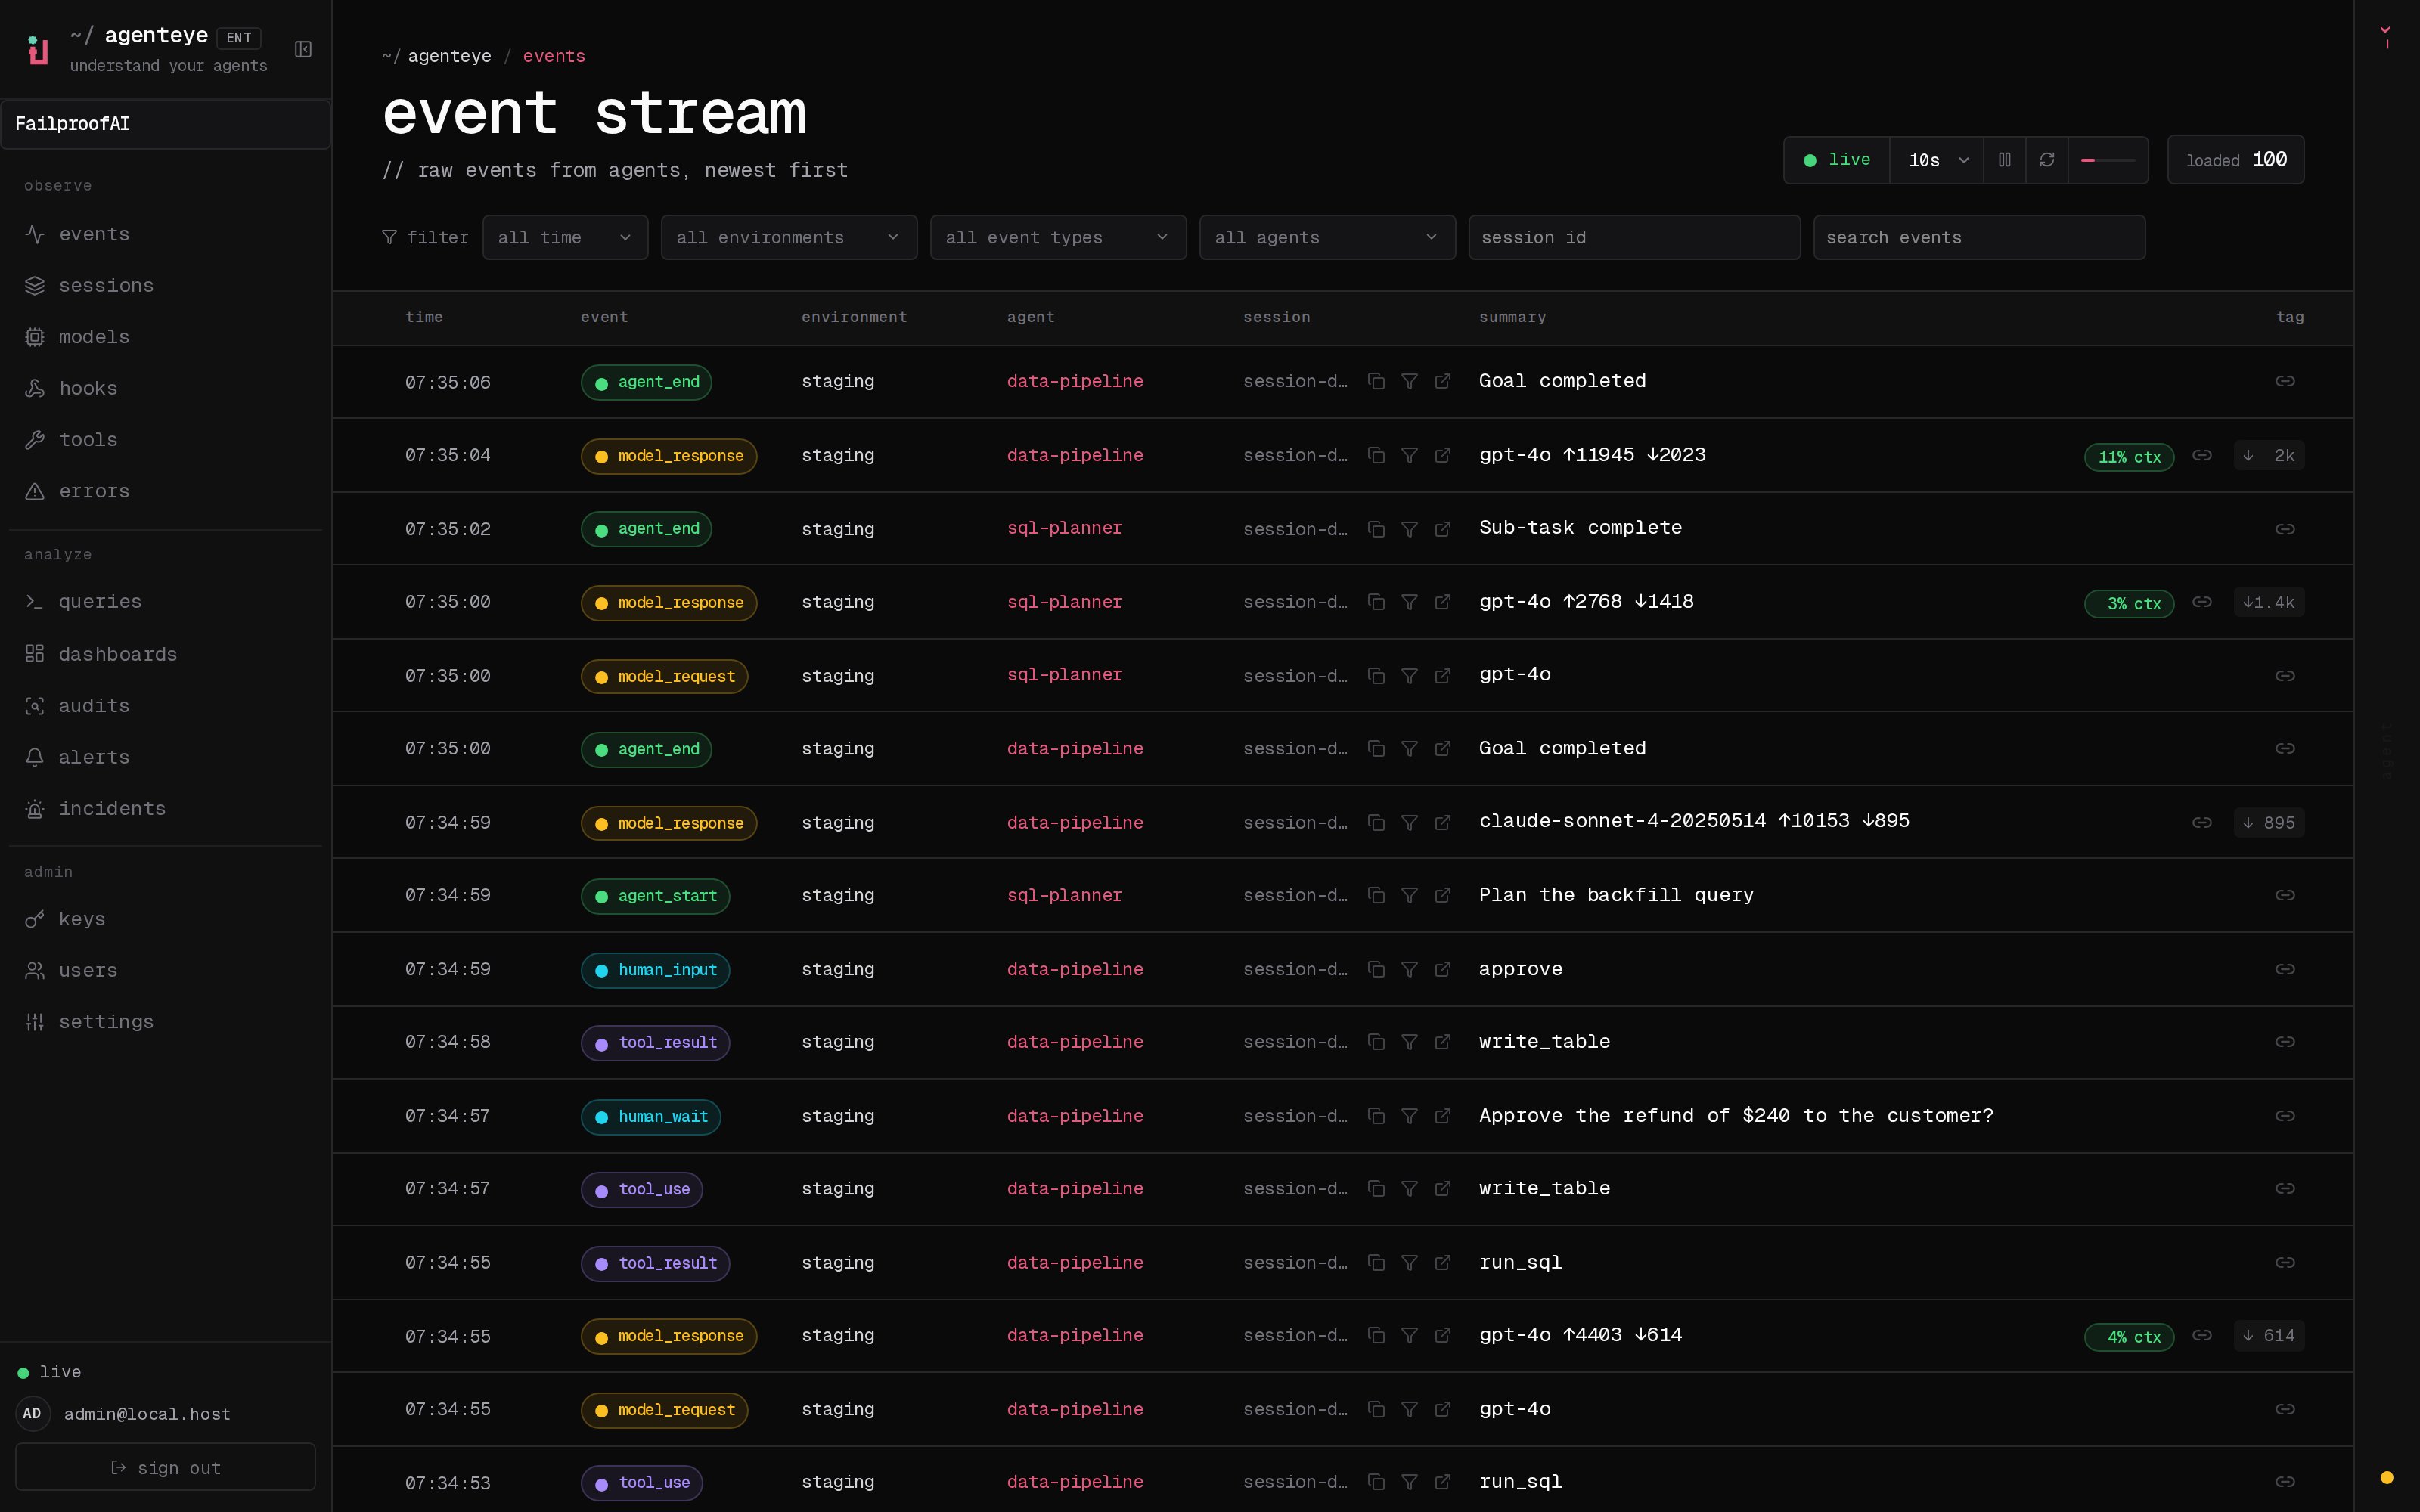
हर agent पर आपकी live pulse
जब कोई agent एक run शुरू करता है, कोई model को call करता है, एक tool fire करता है, एक hook चलाता है, या कोई error से टकराता है, तो वह row stream के top पर दिखाई देता है। यह आपके organization में हर agent से हर event को tail करता है, सबसे नया पहले, ताकि आपके पास हमेशा current picture हो, न कि पुरानी। इसका मतलब है कि किसी box पर log files को tail नहीं करना, machines में grep करना नहीं, timestamps को manually stitch करना नहीं। आप एक page खोलते हैं और आप पहले से ही production को देख रहे हैं। Rows को type द्वारा colour-code किया जाता है, ताकि आप हर line को parse करने की जगह stream को एक नज़र में पढ़ सकें। एक नज़र में, हर row आपको दिखाता है:- इसका type, colour-coded:
agent_start,model_response,tool_use,hook_completed,error, और अधिक। - क्या हुआ का एक-line summary, ताकि आपको शायद ही कभी कुछ खोलना पड़े सिर्फ gist पाने के लिए।
- Token counts इस step के लिए।
- एक context-window fill badge जहां यह लागू होता है, ताकि prompt growth और approaching compaction दिखाई दें इससे पहले कि वे समस्या पैदा करें।
उस एक run को खोजें जो मायने रखता है
जब कुछ गलत दिखता है, तो आप पूरे firehose नहीं चाहते। आप उस single run को चाहते हैं जो टूट गया। Stream तेजी से filter होता है: environment के द्वारा, agent के द्वारा, session के द्वारा, event type के द्वारा, या free text के द्वारा। Session id या agent id के द्वारा filter करें अपने पहले event से आखिरी तक एक run को follow करने के लिए। Event type के द्वारा filter करें एक single kind का isolation करने के लिए, उदाहरण के लिए पूरे org में हरerror एक view में। Filters को stack करें “everything, everywhere” से लेकर “this agent, in prod, erroring” तक एक couple clicks में narrow करने के लिए, फिर जो आप खोजते हैं उस पर काम करें।
Free-text search सीधे एक message, एक tool name, या एक id में जाता है जो आपके पास पहले से है, ताकि एक customer report सेकंड में exact run में बदल जाए।
इसे कहां खोजें
Event Stream आपका org home है। Sign in करें और यह पहली surface है जहां आप land करते हैं,/<org-slug>/ पर, ताकि triage उसी moment शुरू हो जब आप arrive करते हैं।
इसके पीछे, आपके agents SDK के माध्यम से events emit करते हैं, collector उन्हें आपके FailproofAI Observability server को भेजता है, और stream उन्हें tail करता है जैसे वे infrastructure में arrive करते हैं जो आप नियंत्रित करते हैं। जब आप raw trail की जगह rolled-up view चाहते हैं, तो हर run के events एक single row में Sessions पर collapse हो जाते हैं, एक click दूर।
यह raw source of truth है जिस पर हर दूसरी observe surface build होता है, इसलिए जब एक number कहीं और गलत दिखता है, तो stream वह जगह है जहां आप confirm करते हैं कि actually क्या हुआ।
संबंधित
- Sessions: same events rolled up एक row में प्रति run, एक git-style execution graph के साथ।
- Telemetry: आपके agents क्या भेजते हैं और events stream तक कैसे reach करते हैं।
- Error tracking: एक triage surface सब कुछ के लिए जो गलत हुआ।
- Alerts: किसी भी threshold को एक paging rule में turn करें।
- CLI and agents: आपके terminal से same live trail।