

job_id for AgentEye to poll. Results are stored and
surfaced in the dashboard.
This guide covers:
- How session completion is detected.
- The HTTP contract the evaluator must implement.
- Configuring the AgentEye server.
- Viewing results.
- Troubleshooting.
agenteye-evaluator package on PyPI.
How it works
agent_end event for a session, the server
schedules an evaluation. It then POSTs the full event transcript to your
evaluator service, which can either:
-
Return the result inline with
{"status":"done", "scores":{...}, "reasoning":{...}, "summary":"..."}. The result is appended to the session’s evaluation timeline.reasoningandsummaryare optional. -
Defer with
{"status":"pending", "job_id":"abc-123"}. AgentEye then callsGET {EVALUATOR_ENDPOINT}/evaluate/abc-123until your evaluator returns{"status":"done", ...}or{"status":"error", "error":"..."}. The polling cadence is per-job: apendingresponse may includenext_poll_secsto override; otherwise AgentEye uses thedefault_poll_interval_secsvalue fromGET /config; otherwise the server falls back toEVALUATOR_POLLING_INTERVAL_SECS(default 10s). All values are clamped to [1s, 1h].
agent_end (for example, a crashed agent process)
can also be picked up: the evaluator’s GET /config may return
{"inactivity_timeout_secs": 1800}, and AgentEye will evaluate any session
that has gone idle for that long. Set the field to null or omit it to
disable this fallback.
The pipeline is fully no-op when EVALUATOR_ENDPOINT is unset.
A session can accumulate multiple terminal evaluations over time: each
agent_end event (and each manual re-eval from the dashboard) appends a
fresh evaluation row. This is the supported way to evaluate a resumed
conversation: a user ends an agent, comes back later, sends more events,
ends the agent again, and a second evaluation runs against the full updated
transcript. The dashboard renders the most-recent evaluation as the
headline and the prior evaluations as a collapsible timeline. While one
evaluation is running for a session, additional agent_end events for that
session are ignored; the next one after the running evaluation completes
will enqueue a fresh evaluation as usual.
The inactivity fallback re-engages on resumed sessions too: if new events
arrive after a previous terminal evaluation and the session then goes idle
past inactivity_timeout_secs, a fresh evaluation is enqueued.
Transient failures (5xx, 429, timeouts, network errors) are retried with
exponential backoff up to EVALUATOR_MAX_ATTEMPTS; 4xx responses are
terminal. AgentEye is safe to run with multiple horizontally-scaled server
instances; work is partitioned so the same session is never dispatched
twice concurrently.
HTTP contract
Every authenticated route uses bearer token auth. The same value must be configured on both sides:- AgentEye server: env var
EVALUATOR_TOKEN - Evaluator service: configured the same way (the
agenteye-evaluatorSDK readsEVALUATOR_TOKENby convention)
EVALUATOR_TOKEN is unset, the server sends no Authorization header; the
evaluator may then accept anonymous requests, which is fine for an
internal-only network but discouraged on the public internet.
Routes the evaluator must serve
| Route | Body / params | Response |
|---|---|---|
GET /health | none | {"status":"ok"} (open, no auth) |
GET /config | none | {"inactivity_timeout_secs": <int> | null, "default_poll_interval_secs": <int> | omitted} |
POST /evaluate | EvalRequest JSON | {"status":"done", ...} or {"status":"pending", "job_id":"..."} |
GET /evaluate/{id} | none | same response shape as /evaluate |
EvalRequest body sent by the server
Response shapes
Sync (done):reasoning (a per-score justification map) and summary (an overall
one-paragraph narrative) are both optional. Keys in reasoning should
mirror keys in scores; the dashboard renders each entry inline under
its score bar. Older evaluators that return only scores continue to
work unchanged; reasoning and summary simply read as null and
the corresponding UI affordances are omitted.
Async (deferred):
next_poll_secs is optional; if omitted the server falls back to the
evaluator’s default_poll_interval_secs from /config, then to its own
EVALUATOR_POLLING_INTERVAL_SECS env var.
Terminal evaluator-side error:
error for the session.
Writing an evaluator with the SDK
Theagenteye-evaluator Python package gives you a typed FastAPI
wrapper that implements the HTTP contract above. Install it from PyPI:
app instance is ASGI-callable, so uvicorn module:app runs it.
For evaluators that need to defer expensive work, return JobPending
instead and register a @app.job_lookup handler; the AgentEye server
polls GET /evaluate/{job_id} until you return a terminal status or the
EVALUATOR_MAX_POLL_DURATION_SECS cap (default 1 h) elapses.
Full API reference, async pattern, and event schema: the agenteye-evaluator
README ships inside each release tarball on the
agenteye-enterprise releases page,
or you can read it on the package’s PyPI page.
Running an evaluator on Kubernetes
The evaluator is your service: AgentEye does not ship a default evaluator container. The release includes reference Kubernetes manifests underdeploy/examples/evaluator/ that you can apply as-is
after swapping in your image and a shared bearer token.
1. Containerize your evaluator
A minimal Dockerfile for your evaluator:runAsNonRoot (UID 10001) keeps the container compatible with Pod
Security restricted profiles.
2. Create the shared bearer token
EVALUATOR_TOKEN on the AgentEye server. The
server sends Authorization: Bearer <token> on every request; the SDK
uses hmac.compare_digest for a constant-time check and rejects
mismatches with HTTP 401.
3. Apply the example manifests
- A 2-replica Deployment with
runAsNonRoot, read-only root filesystem, all capabilities dropped, liveness + readiness on/health - A ClusterIP Service on port 9000
- A
secret.example.yamltemplate (intentionally excluded from the Kustomization; create the real secret out-of-band so no token lands in git)
4. Wire AgentEye to it
On the AgentEye server, set:EVALUATOR_WORKERS × EVALUATOR_CLAIM_BATCH
concurrent requests across all evaluator pods (defaults: 2 × 4 = 8).
Scale replicas and per-pod resource limits in concert with these
server-side knobs.
Verification
GET /evaluations on the AgentEye
server should return a row with status: "done" and the scores your
evaluator produced.
Configuring the AgentEye server
Set on the server process:| Env var | Meaning |
|---|---|
EVALUATOR_ENDPOINT | Base URL of your evaluator (http://evaluator:9000). Unset = pipeline disabled. |
EVALUATOR_TOKEN | Bearer token. Must equal the value the evaluator service is configured with. |
EVALUATOR_WORKERS | Worker tasks per server instance (default 2). |
EVALUATOR_CLAIM_BATCH | Rows claimed per worker tick (default 4). Batches are processed concurrently; effective concurrency on your evaluator endpoint is EVALUATOR_WORKERS × EVALUATOR_CLAIM_BATCH. |
EVALUATOR_POLL_IDLE_SECS | How long a worker sleeps between dispatch attempts when no evaluation is due (default 2s). |
EVALUATOR_POLLING_INTERVAL_SECS | Final fallback for GET /evaluate/{id} cadence when neither the per-response next_poll_secs nor the evaluator’s default_poll_interval_secs is set (default 10s). |
EVALUATOR_REQUEST_TIMEOUT_MS | Per-request timeout (default 30000). |
EVALUATOR_MAX_ATTEMPTS | After this many transient failures the result is recorded as terminal error (default 5). |
EVALUATOR_CONFIG_REFRESH_SECS | GET /config cadence (default 300). |
EVALUATOR_MAX_POLL_DURATION_SECS | Maximum wallclock time a session may remain in the polling queue before it’s terminated as timeout (default 3600s). Guards against an evaluator that keeps returning pending forever. |
agenteye-evaluator Secret with both keys set. On the bundled Kubernetes manifests, the server reads EVALUATOR_ENDPOINT and EVALUATOR_TOKEN from this optional Secret. Create it via your organization’s standard secret-management process, then restart the server Deployment to pick up the change.
The tuning knobs above are not wired by default; expose the corresponding environment variables on the server container in your Deployment manifest if you need to override the defaults.
See deployment.md for the full env var table.
API reference
| Method | Path | Required permission | Purpose |
|---|---|---|---|
GET | /evaluations | evaluations:read | Query terminal results. Supports session_id, agent_id, environment, status (done/error/timeout), ts_from, ts_to, cursor, limit, score_filters, latest_per_session. limit defaults to 50 and is capped at 200 (note this differs from /events, which caps at 1000). environment accepts a comma-separated list (e.g. environment=prod,staging); single values still work. With latest_per_session=true the response contains at most one row per session_id (the most recent by completed_at) used by the sessions-list page to collapse a session’s evaluation timeline to its current headline. Defaults to false (returns the full history). |
GET | /evaluations/aggregate | evaluations:read | Rolled-up eval health for a filtered slice: total count, a done/error/timeout breakdown, per-score-key stats (count/avg/min/max/p50 over the arbitrary scores keys), and a time-bucketed timeline. Accepts the same filter params as /evaluations plus featured_keys (CSV of score keys to trend) and latest_per_session. Powers the Dashboards feature; metrics are exact over the whole matching set, not sampled. |
GET | /evaluations/environments | evaluations:read | Distinct environment values from the evaluations table. Used to populate filter dropdowns scoped to evaluation-readable data. |
GET | /evaluation-jobs | evaluations:read | Visibility into in-flight evaluations. Filter by status (pending/polling). |
GET | /events | events:read | Stream a session’s raw events. Supports session_id, agent_id, event_type (CSV), environment (CSV), ts_from, ts_to, cursor, limit, and order. order is desc (newest-first, the default) or asc (oldest-first); an unrecognized value falls back to desc. Cursor-paginate via the response’s next_cursor (an event id): pass it back as cursor to get the next page; with asc the next page is the events after that id, with desc the events before it. limit defaults to 50 and is capped at 1000. |
GET | /sessions/:session_id/export | events:read | Returns the exact JSON body the evaluator would receive for this session, served as a downloadable attachment named session-<id>.json. Useful for replaying production sessions through agenteye-evaluator for offline testing. The bytes are byte-identical to what the evaluator pipeline sends. |
POST | /sessions/:session_id/re-evaluate | evaluations:trigger | Enqueue a fresh evaluation for a session; runs whether or not a prior evaluation exists. The new result is appended to the session’s evaluation timeline rather than overwriting the previous one, so prior scores remain visible as history. Returns 202 on enqueue, 404 for an unknown session, 409 if an evaluation is already in flight. Use this after deploying a new evaluator, or for sessions that never emitted agent_end. |
Filtering by score range: score_filters
GET /evaluations accepts an optional score_filters parameter that
narrows results by numeric values inside the scores object. The
parameter is a comma-separated list of key:min..max entries; either
bound may be omitted. Multiple entries combine with logical AND. Rows
where the named key is absent or non-numeric are excluded. A request may
carry at most 20 filter entries; exceeding that returns HTTP 400.
Examples:
/evaluations response object has these fields:
| Field | Type | Notes |
|---|---|---|
evaluation_id | string (UUID) | The canonical identifier for this terminal evaluation. Each terminal evaluation gets a new UUID; a single session can hold multiple. |
id | string (UUID) | Backwards-compatibility alias carrying the same value as evaluation_id. |
session_id | string | The session this evaluation ran against. A session can have multiple evaluations in the timeline. |
agent_id | string | Identifies the agent that produced the session. |
environment | string | Environment label copied from the session. |
status | enum | One of "done", "error", "timeout". |
scores | object | null | Scores returned by your evaluator. |
reasoning | object | null | Optional per-score justification map returned by your evaluator. Keys typically mirror those in scores. The dashboard renders each entry under its score bar. |
summary | string | null | Optional one-paragraph overall narrative returned by your evaluator. The dashboard renders this above the per-score breakdown as the evaluation’s headline. |
error | string | null | Populated on "error" / "timeout" only. |
attempt_count | integer | Number of dispatch attempts (≥ 1). |
duration_ms | integer | null | Duration of the final attempt. |
completed_at | string (ISO 8601 UTC) | When the terminal result was recorded. Results are ordered by completed_at (newest first). |
created_at | string (ISO 8601 UTC) | Carries the same timestamp as completed_at (write-once semantics). |
Permissions
| Permission | Grants |
|---|---|
evaluations:read | List evaluation results, view scores in the dashboard, and load dashboard health metrics. |
evaluations:trigger | Manually enqueue an evaluation for a session via POST /sessions/:session_id/re-evaluate or the dashboard’s re-evaluate button. |
dashboards:read | View saved dashboards (also needs evaluations:read to load their metrics). |
dashboards:write | Create and edit dashboards. |
dashboards:delete | Delete dashboards. |
ADMIN_KEY, ADMIN_EMAIL) automatically receives these.
Viewing results
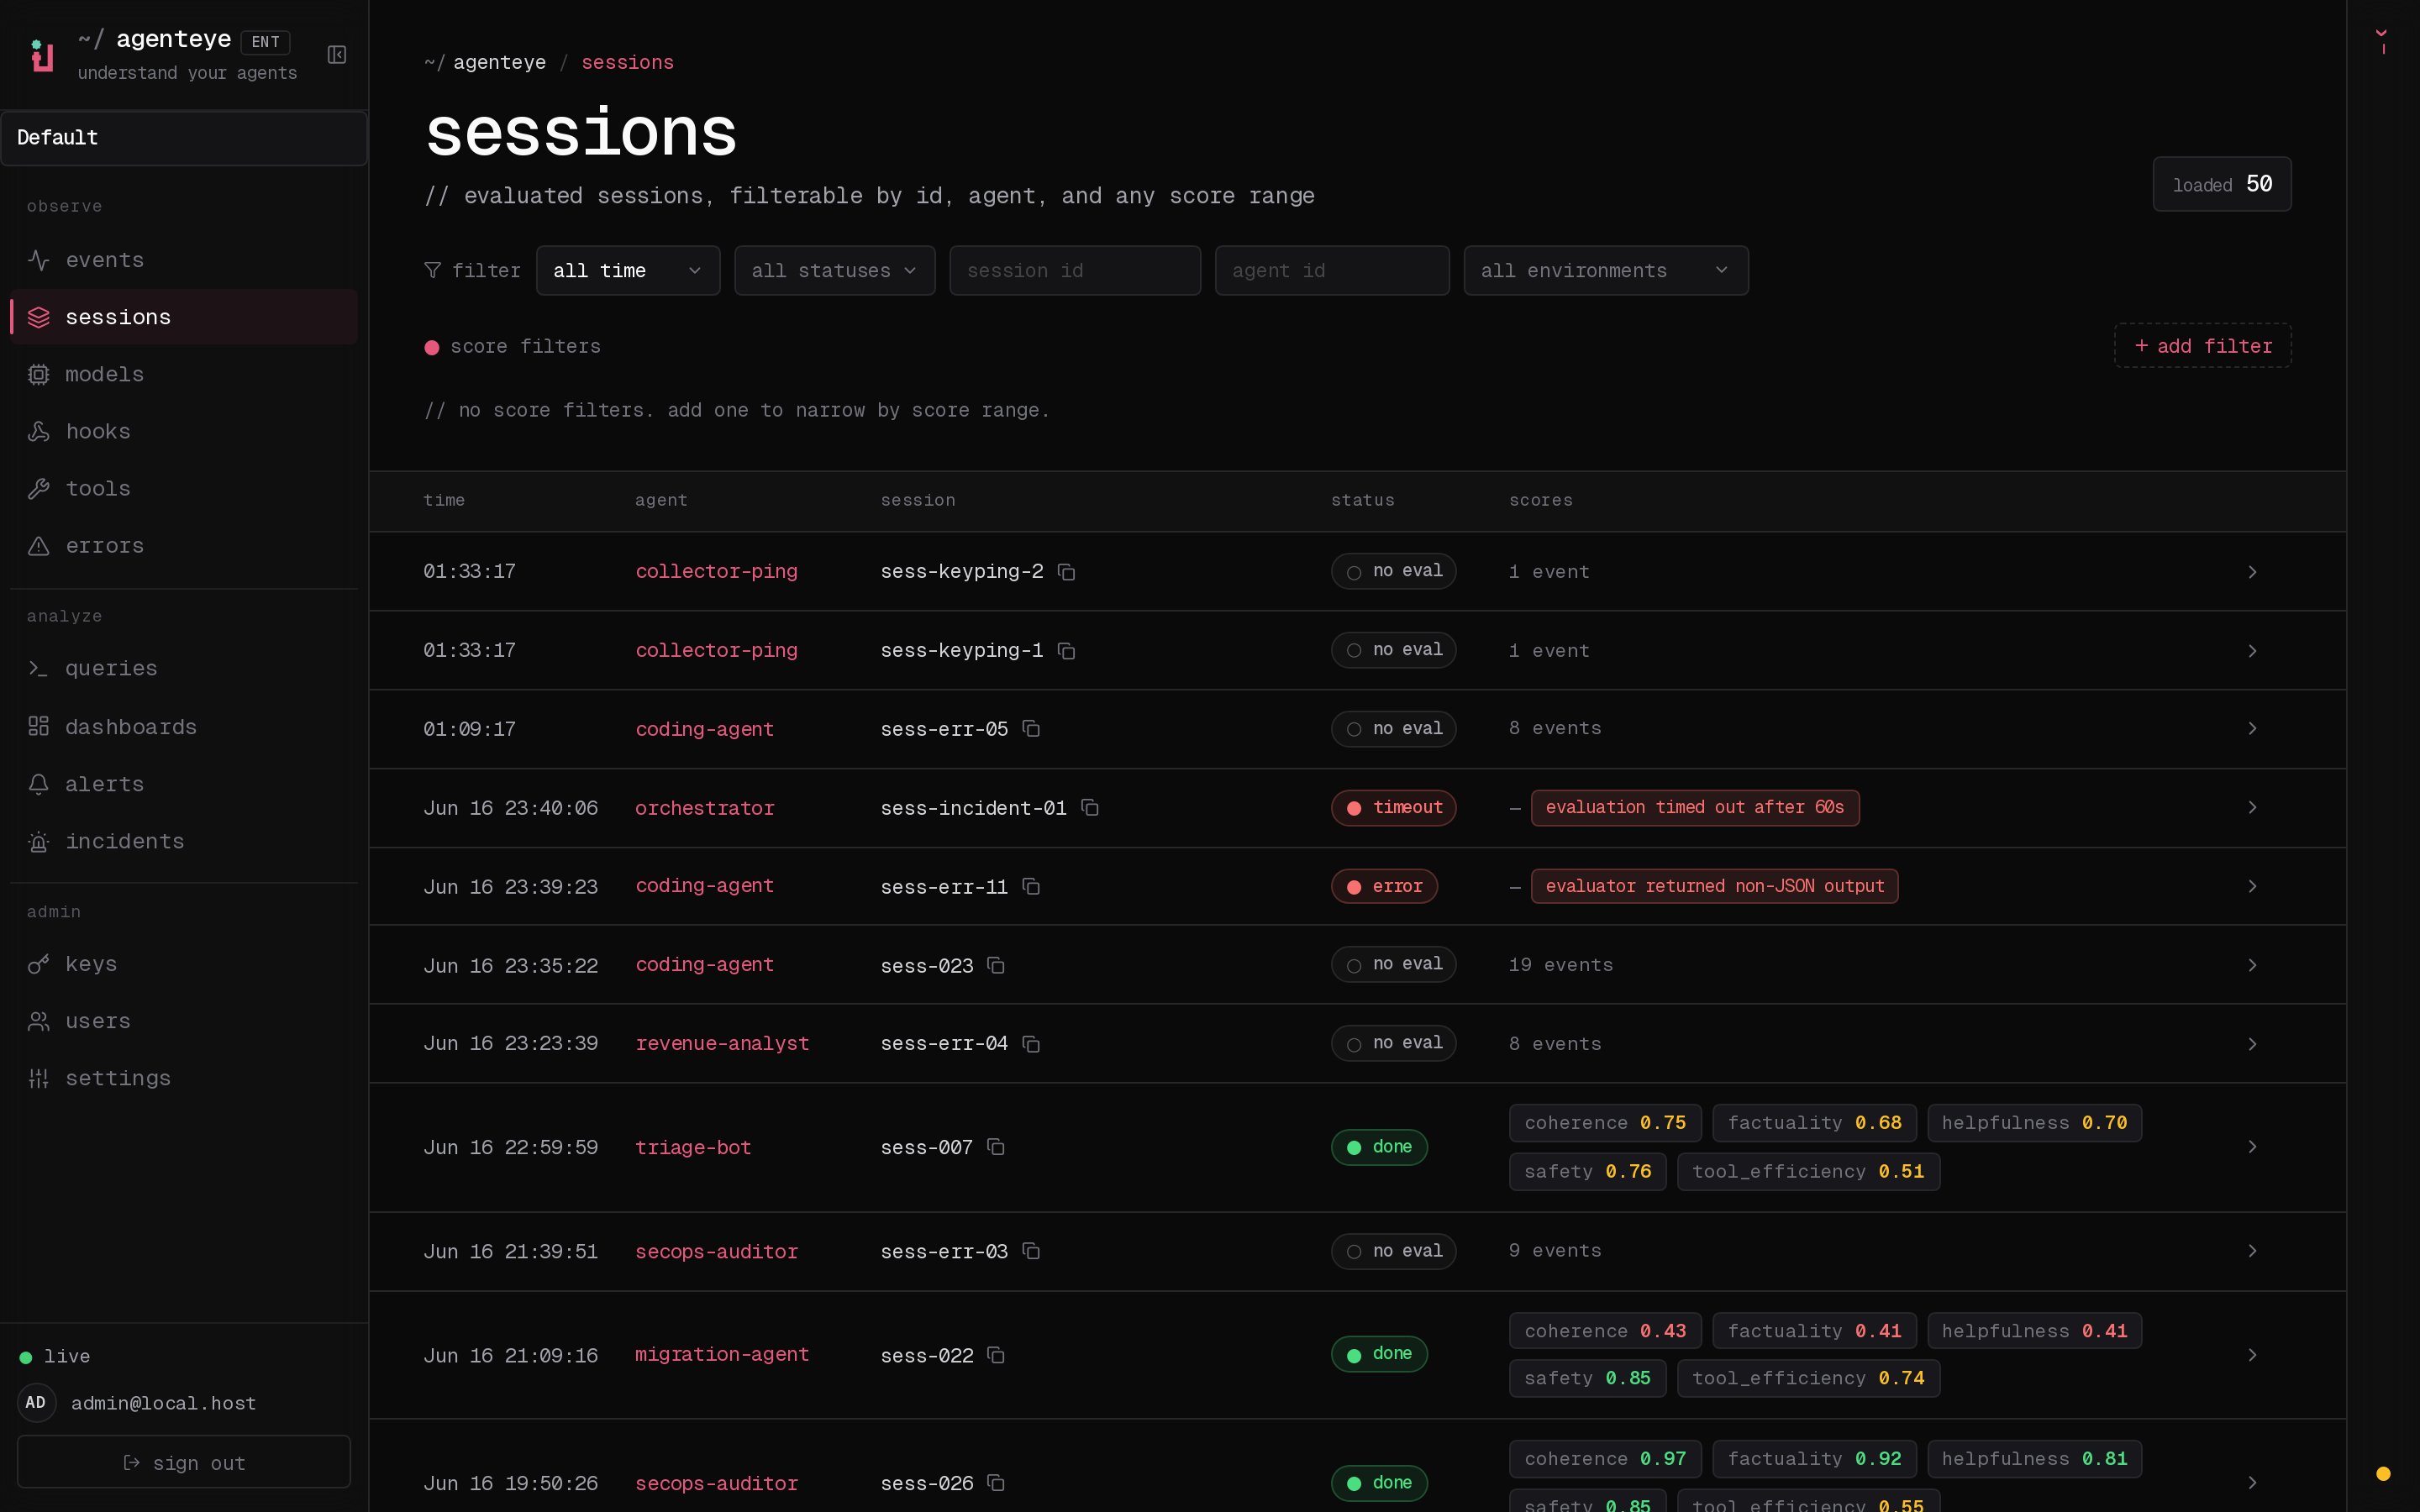
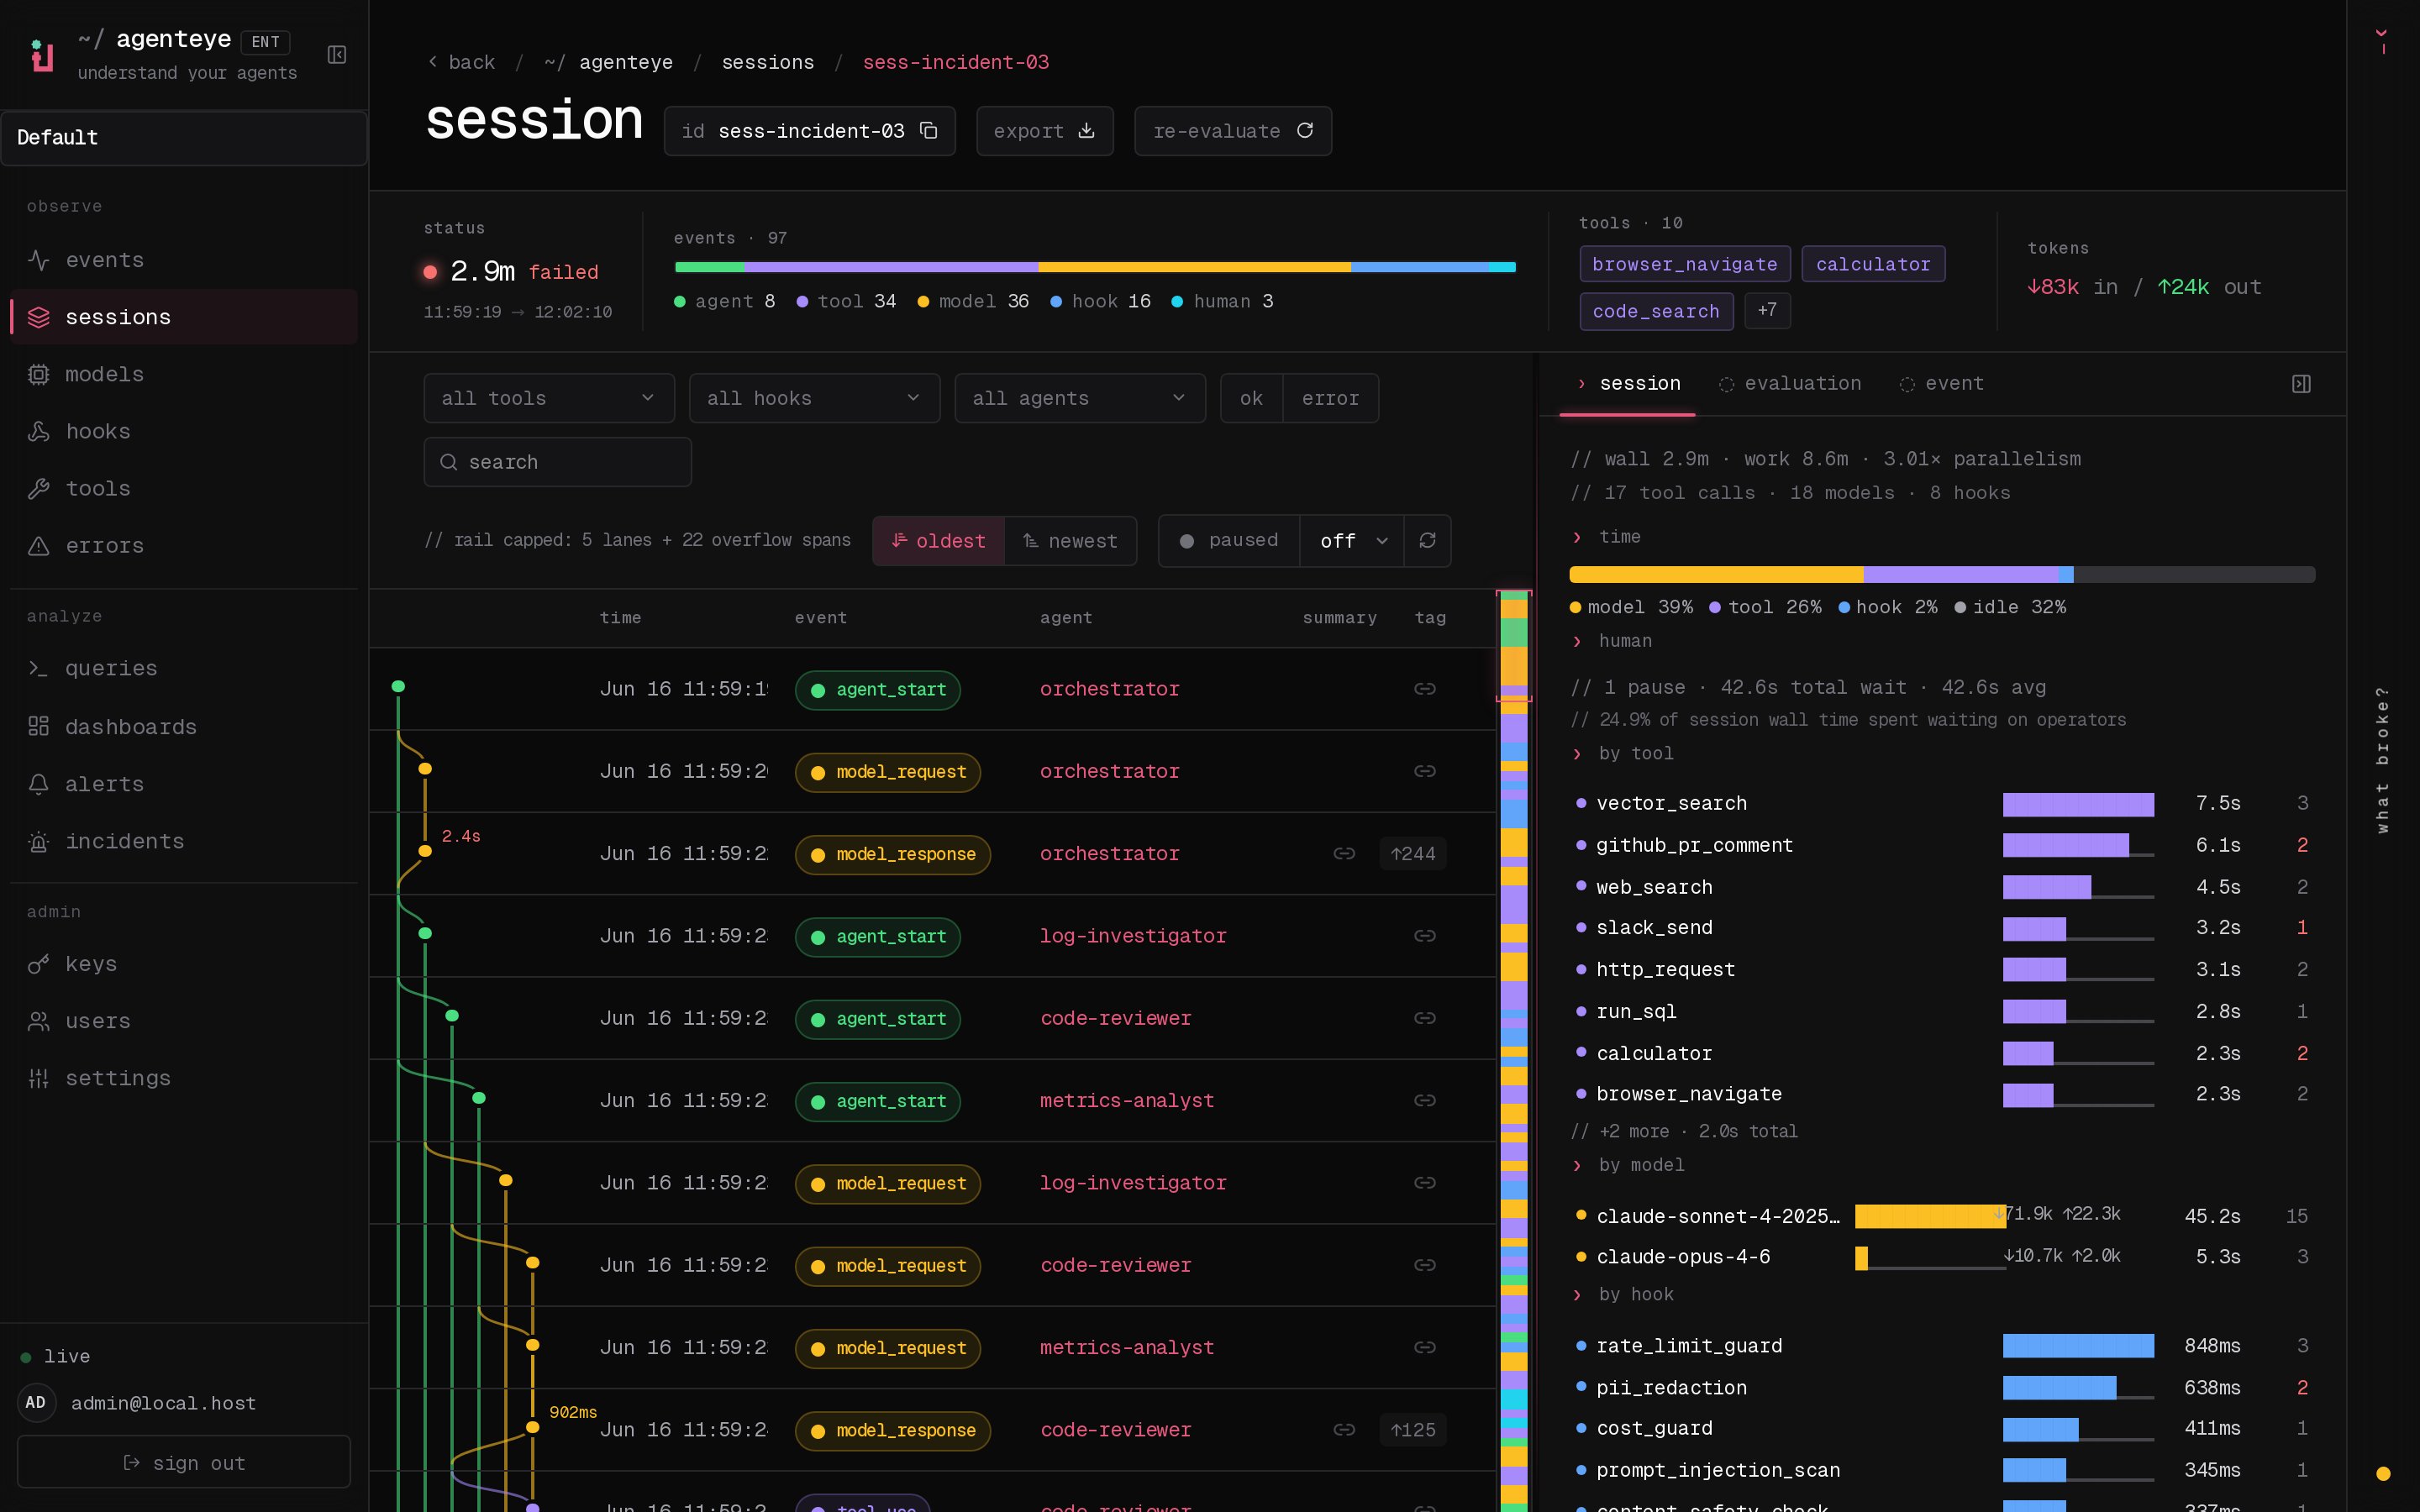
/sessions/<id>: events timeline + a right rail showing the session’s scores and any error from the dispatch attempt. If your key hasevaluations:trigger, a re-evaluate button appears next to the export button, useful for sessions that never emittedagent_end, or for refreshing scores after deploying a new evaluator. The dashboard polls for the new result and updates the right rail when it lands./sessions: filterable session grid; the score column shows each session’s evaluation status and scores at a glance./dashboards: saved eval-health views (see Dashboards below).
Dashboards
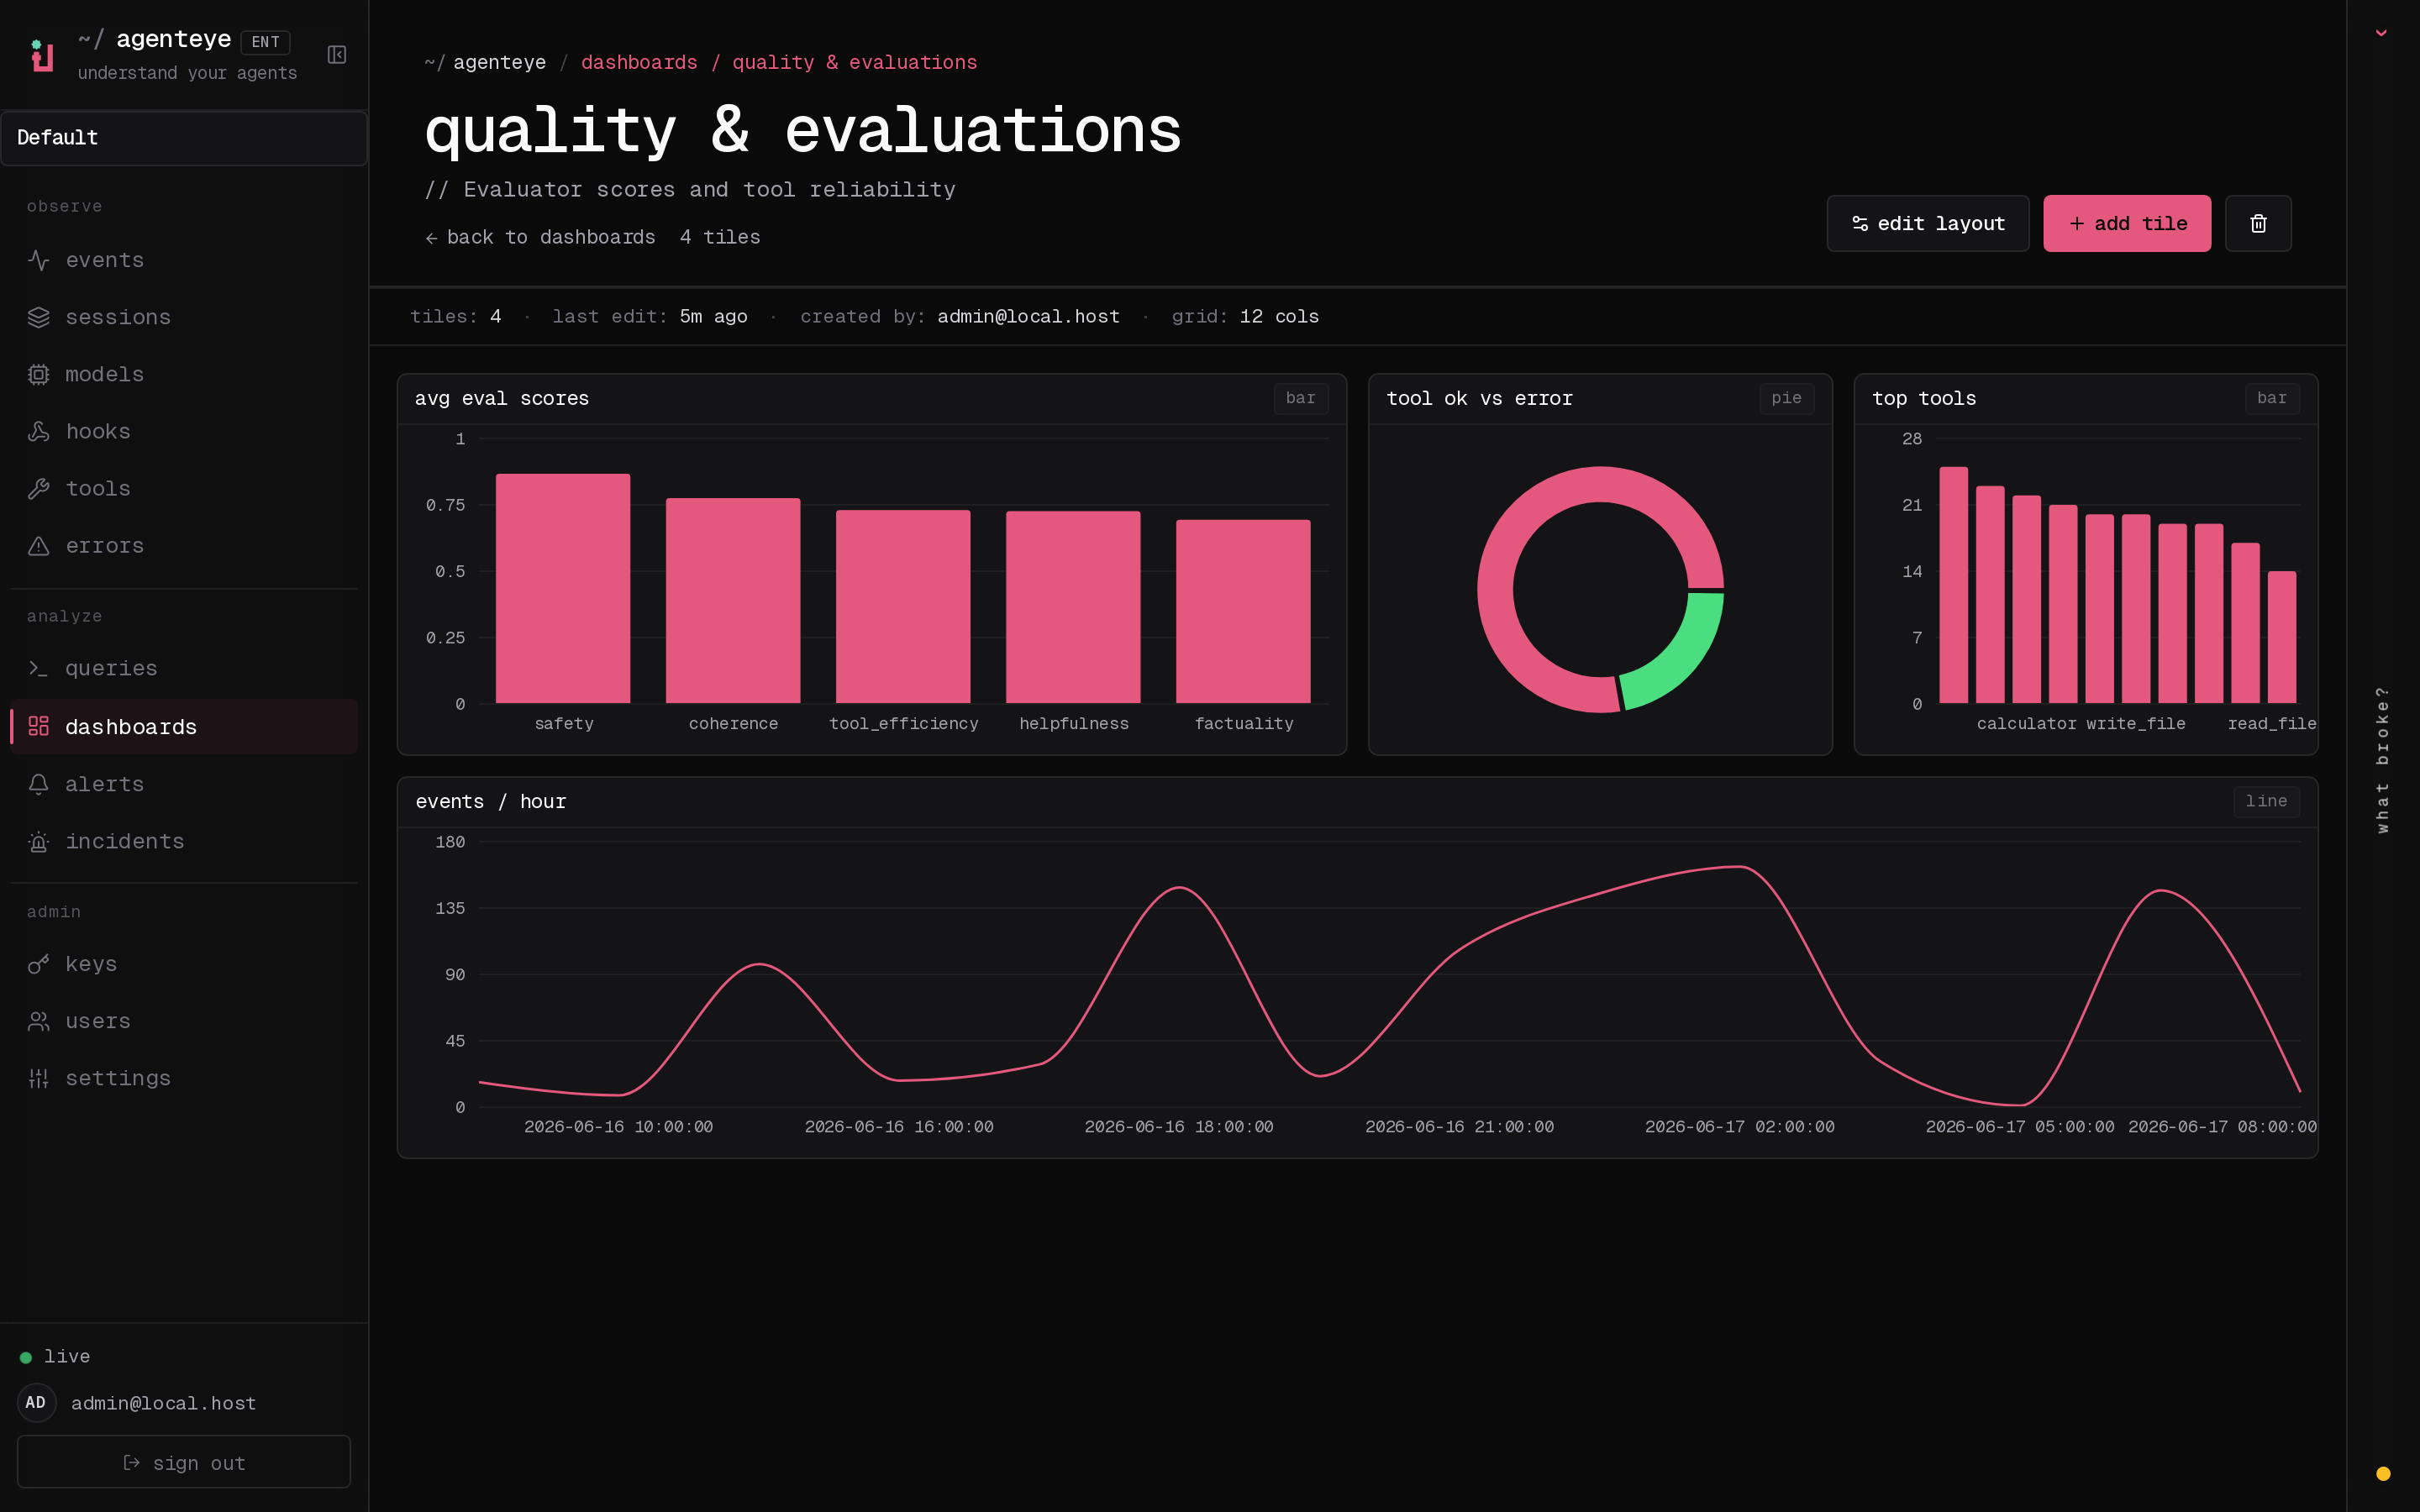
The Dashboards page (/dashboards) lets you save a combination of evaluation
filters as a named, reusable view and watch how that slice of evaluations is
doing at a glance. Dashboards are shared across your whole organization;
everyone with dashboards:read sees the same set.
Each dashboard pins:
- Filters: the same controls as the sessions page: environment, status,
agent, a rolling time window, and score-range filters (
key:min..max). - A display configuration: which score keys to feature, the green/amber/red health thresholds, which panels to show, and whether to collapse to the latest evaluation per session.
GET /evaluations/aggregate), so
the numbers are exact rather than sampled.
dashboards:read and evaluations:read;
creating and editing needs dashboards:write; deleting needs dashboards:delete.
The bootstrap admin receives all of these automatically.
Troubleshooting
Sessions exist but no evaluations are created. ConfirmEVALUATOR_ENDPOINT
is set on the server process, that the server and evaluator share the same
EVALUATOR_TOKEN value, and that the evaluator’s /health endpoint is
reachable from the server. With EVALUATOR_ENDPOINT unset the pipeline is a
no-op.
In-flight evaluations pile up. Query GET /evaluation-jobs to see the
in-flight queue. Inspect attempt_count, next_attempt_at, and last_error
on each row. Common causes: evaluator service unreachable or returning 5xx
(retried with backoff), wrong EVALUATOR_TOKEN (401 is terminal), or an
async evaluator that returns pending indefinitely (see below).
Sessions completed but no terminal evaluation. Query
GET /evaluation-jobs?status=polling; the result may still be in flight.
If a job is stuck in pending, the server is having trouble reaching the
evaluator; check that the evaluator is up and that EVALUATOR_TOKEN matches.
HTTP 401 from evaluator: invalid bearer token. The EVALUATOR_TOKEN
on the server does not match the value the evaluator service is configured
with. They must be identical.
Async evaluator returns pending forever. The server polls
GET /evaluate/{job_id} until the evaluator returns done or error, or
until EVALUATOR_MAX_POLL_DURATION_SECS (default 1 h) elapses. After the cap
the evaluation is recorded as timeout and removed from the in-flight queue.
Raise EVALUATOR_MAX_POLL_DURATION_SECS if your evaluator legitimately needs
longer than the default.