

What is AgentEye?
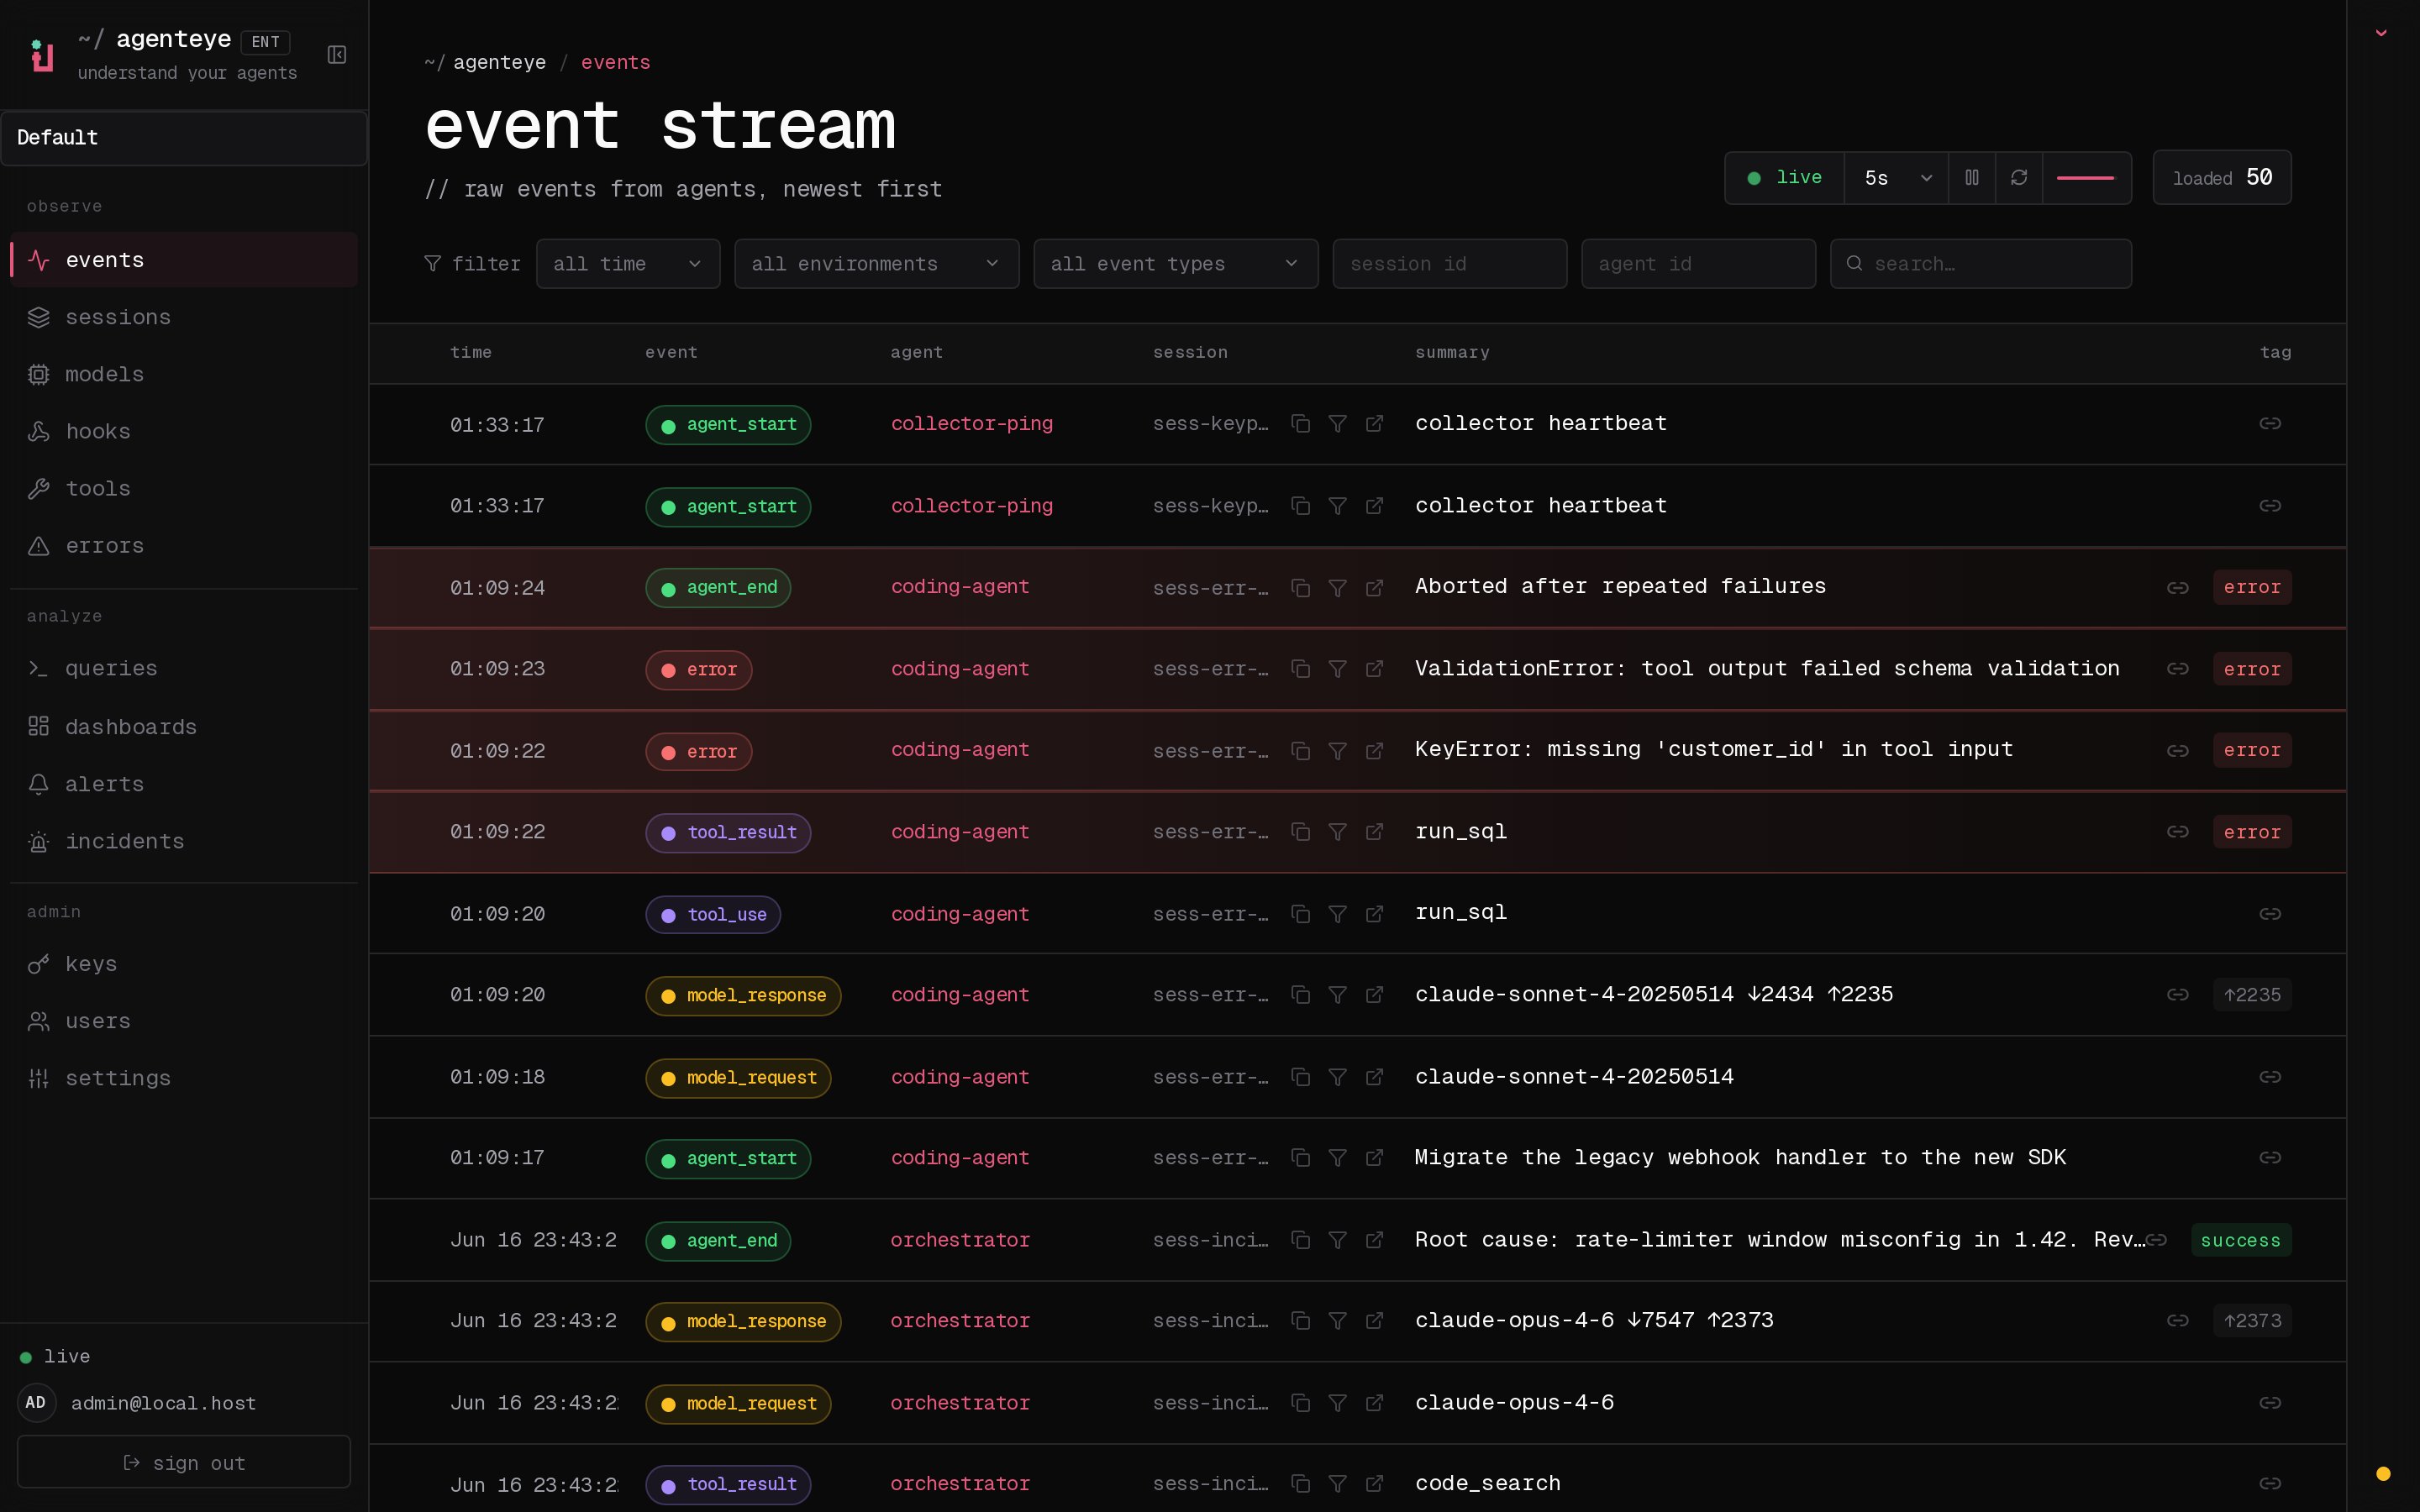
AgentEye is a self-hosted observability and evaluation platform for AI agents. It records what your agents do — every step of a run — and automatically scores the quality of each completed run, so you can see how your agents behave in production and catch regressions before your users do. The data flows in one direction: your agent code emits events through the Python SDK → a lightweight collector daemon batches and ships them to the server → events and analytics are stored in ClickHouse (operational state such as organizations, users, API keys, dashboards, and saved queries lives in Postgres) → you explore everything in the dashboard. What you get:- Events — the raw, per-step trail of every agent run (tool calls, model calls, hooks, errors).
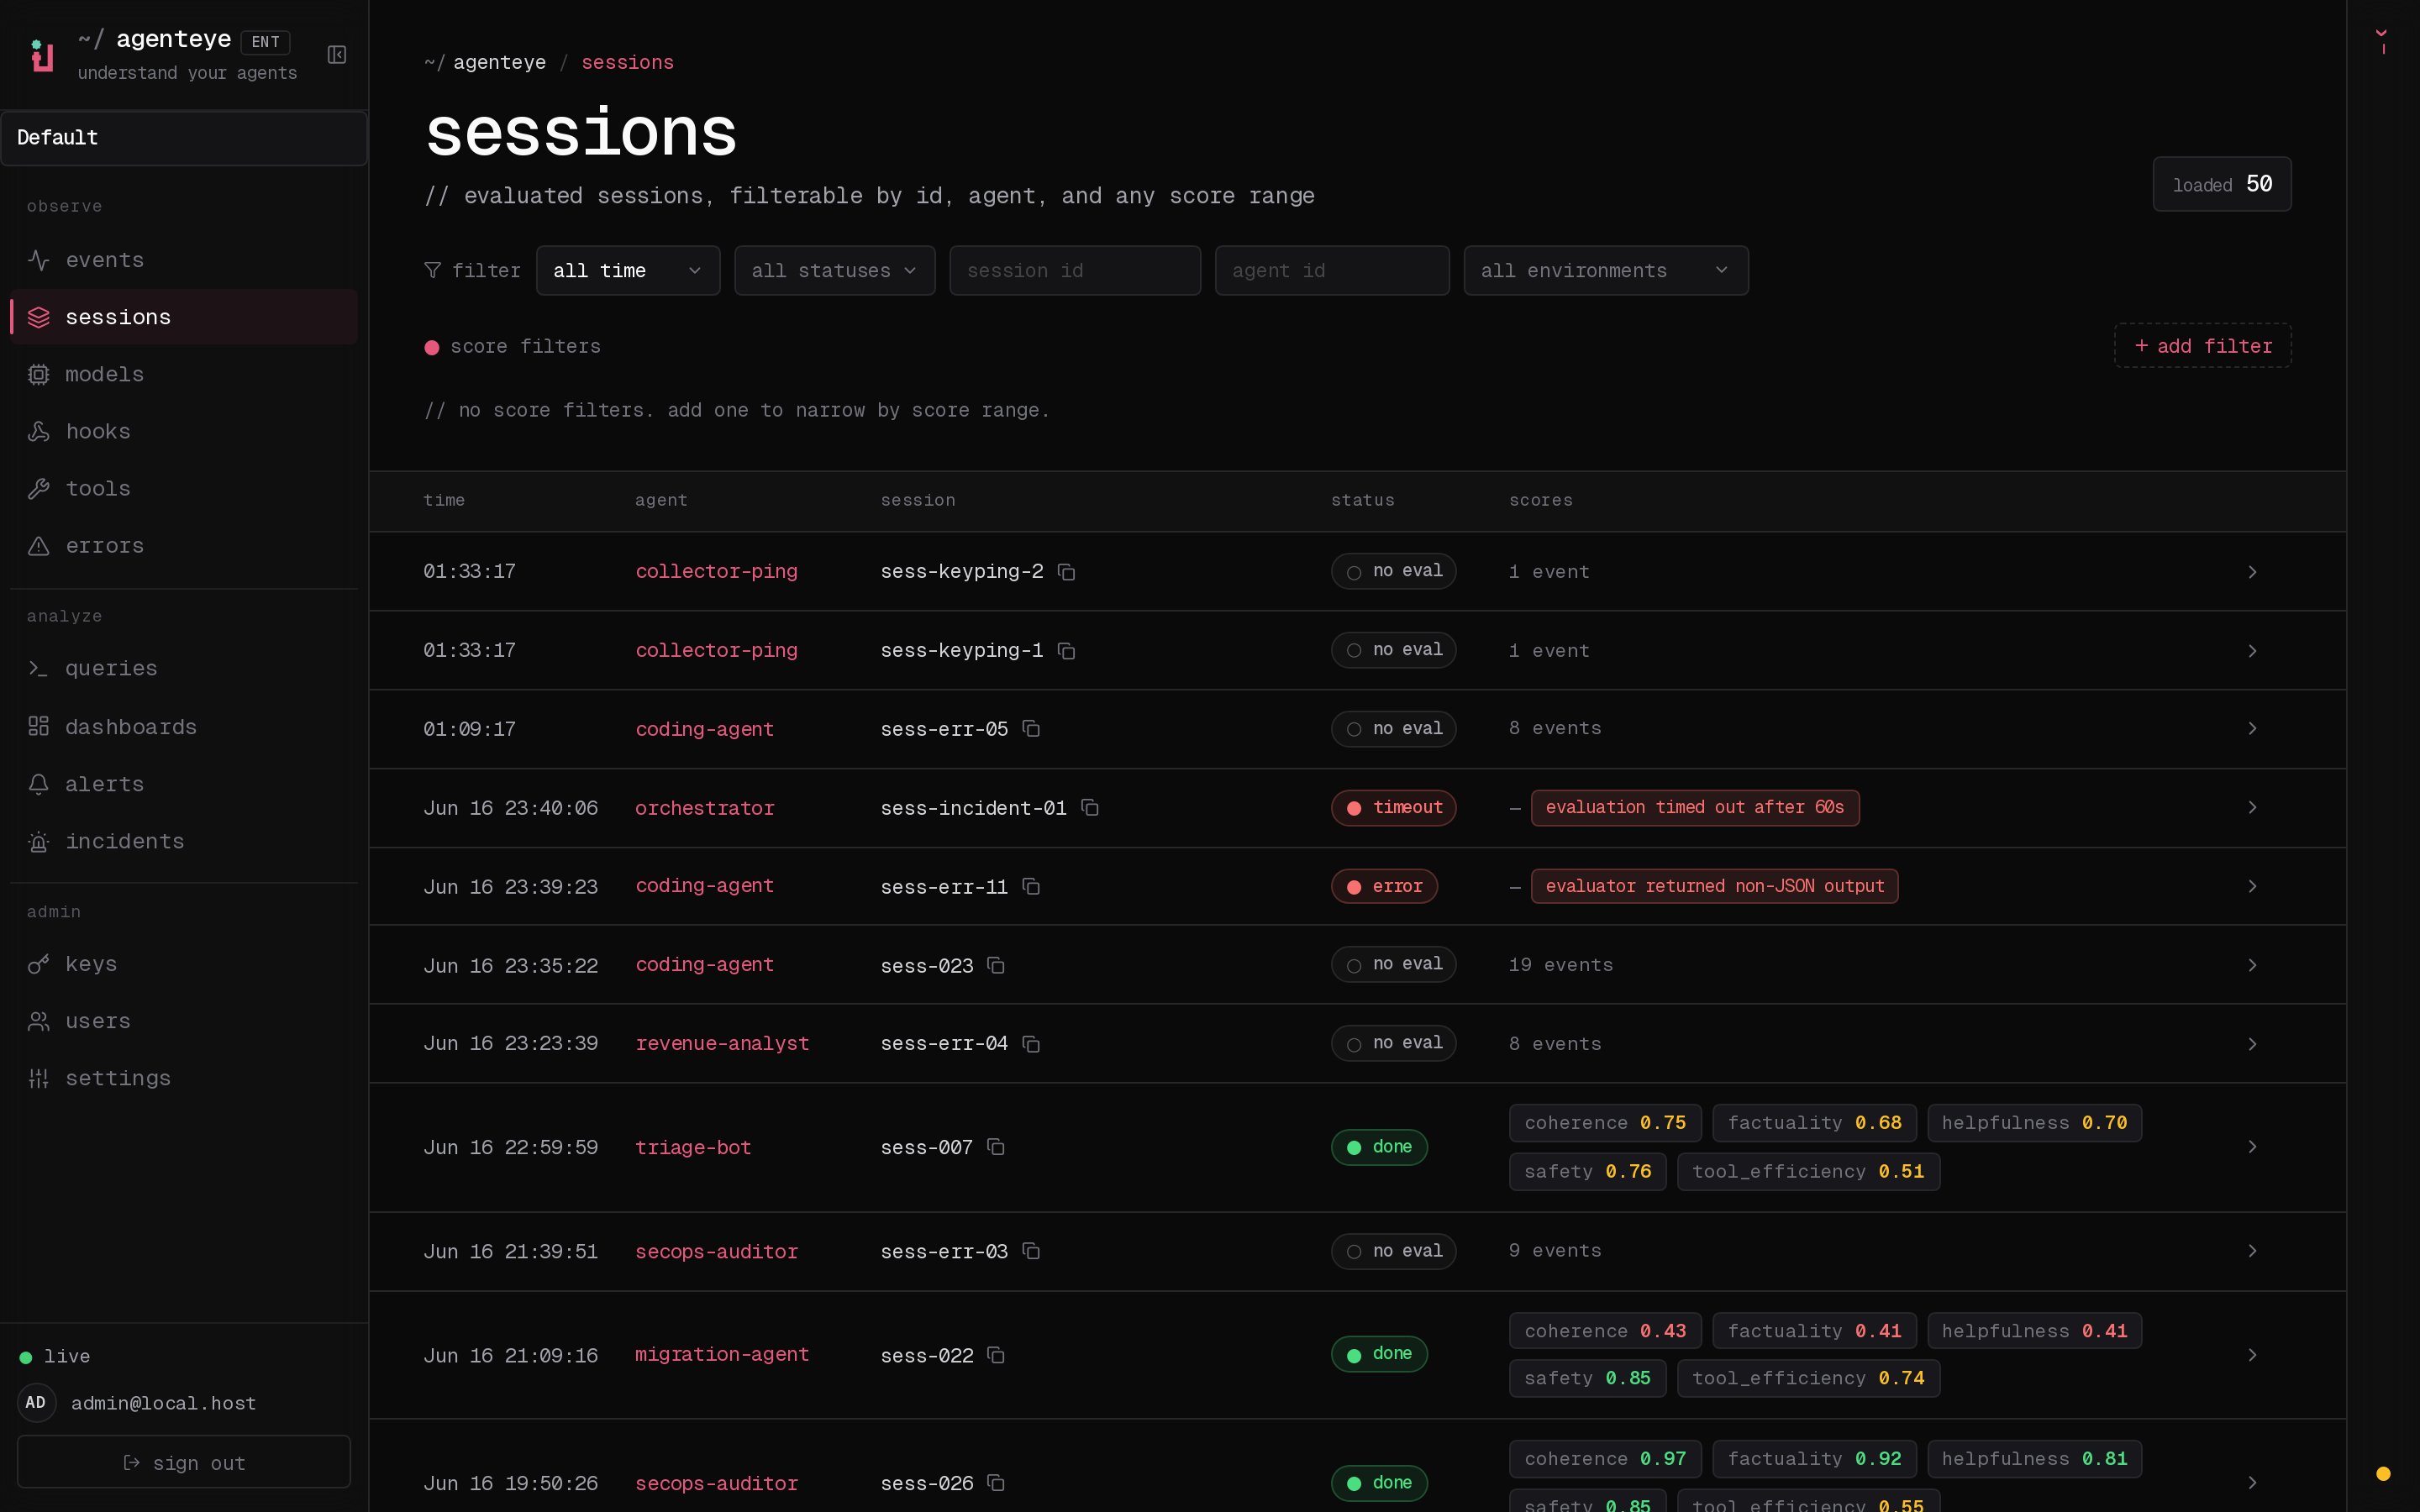
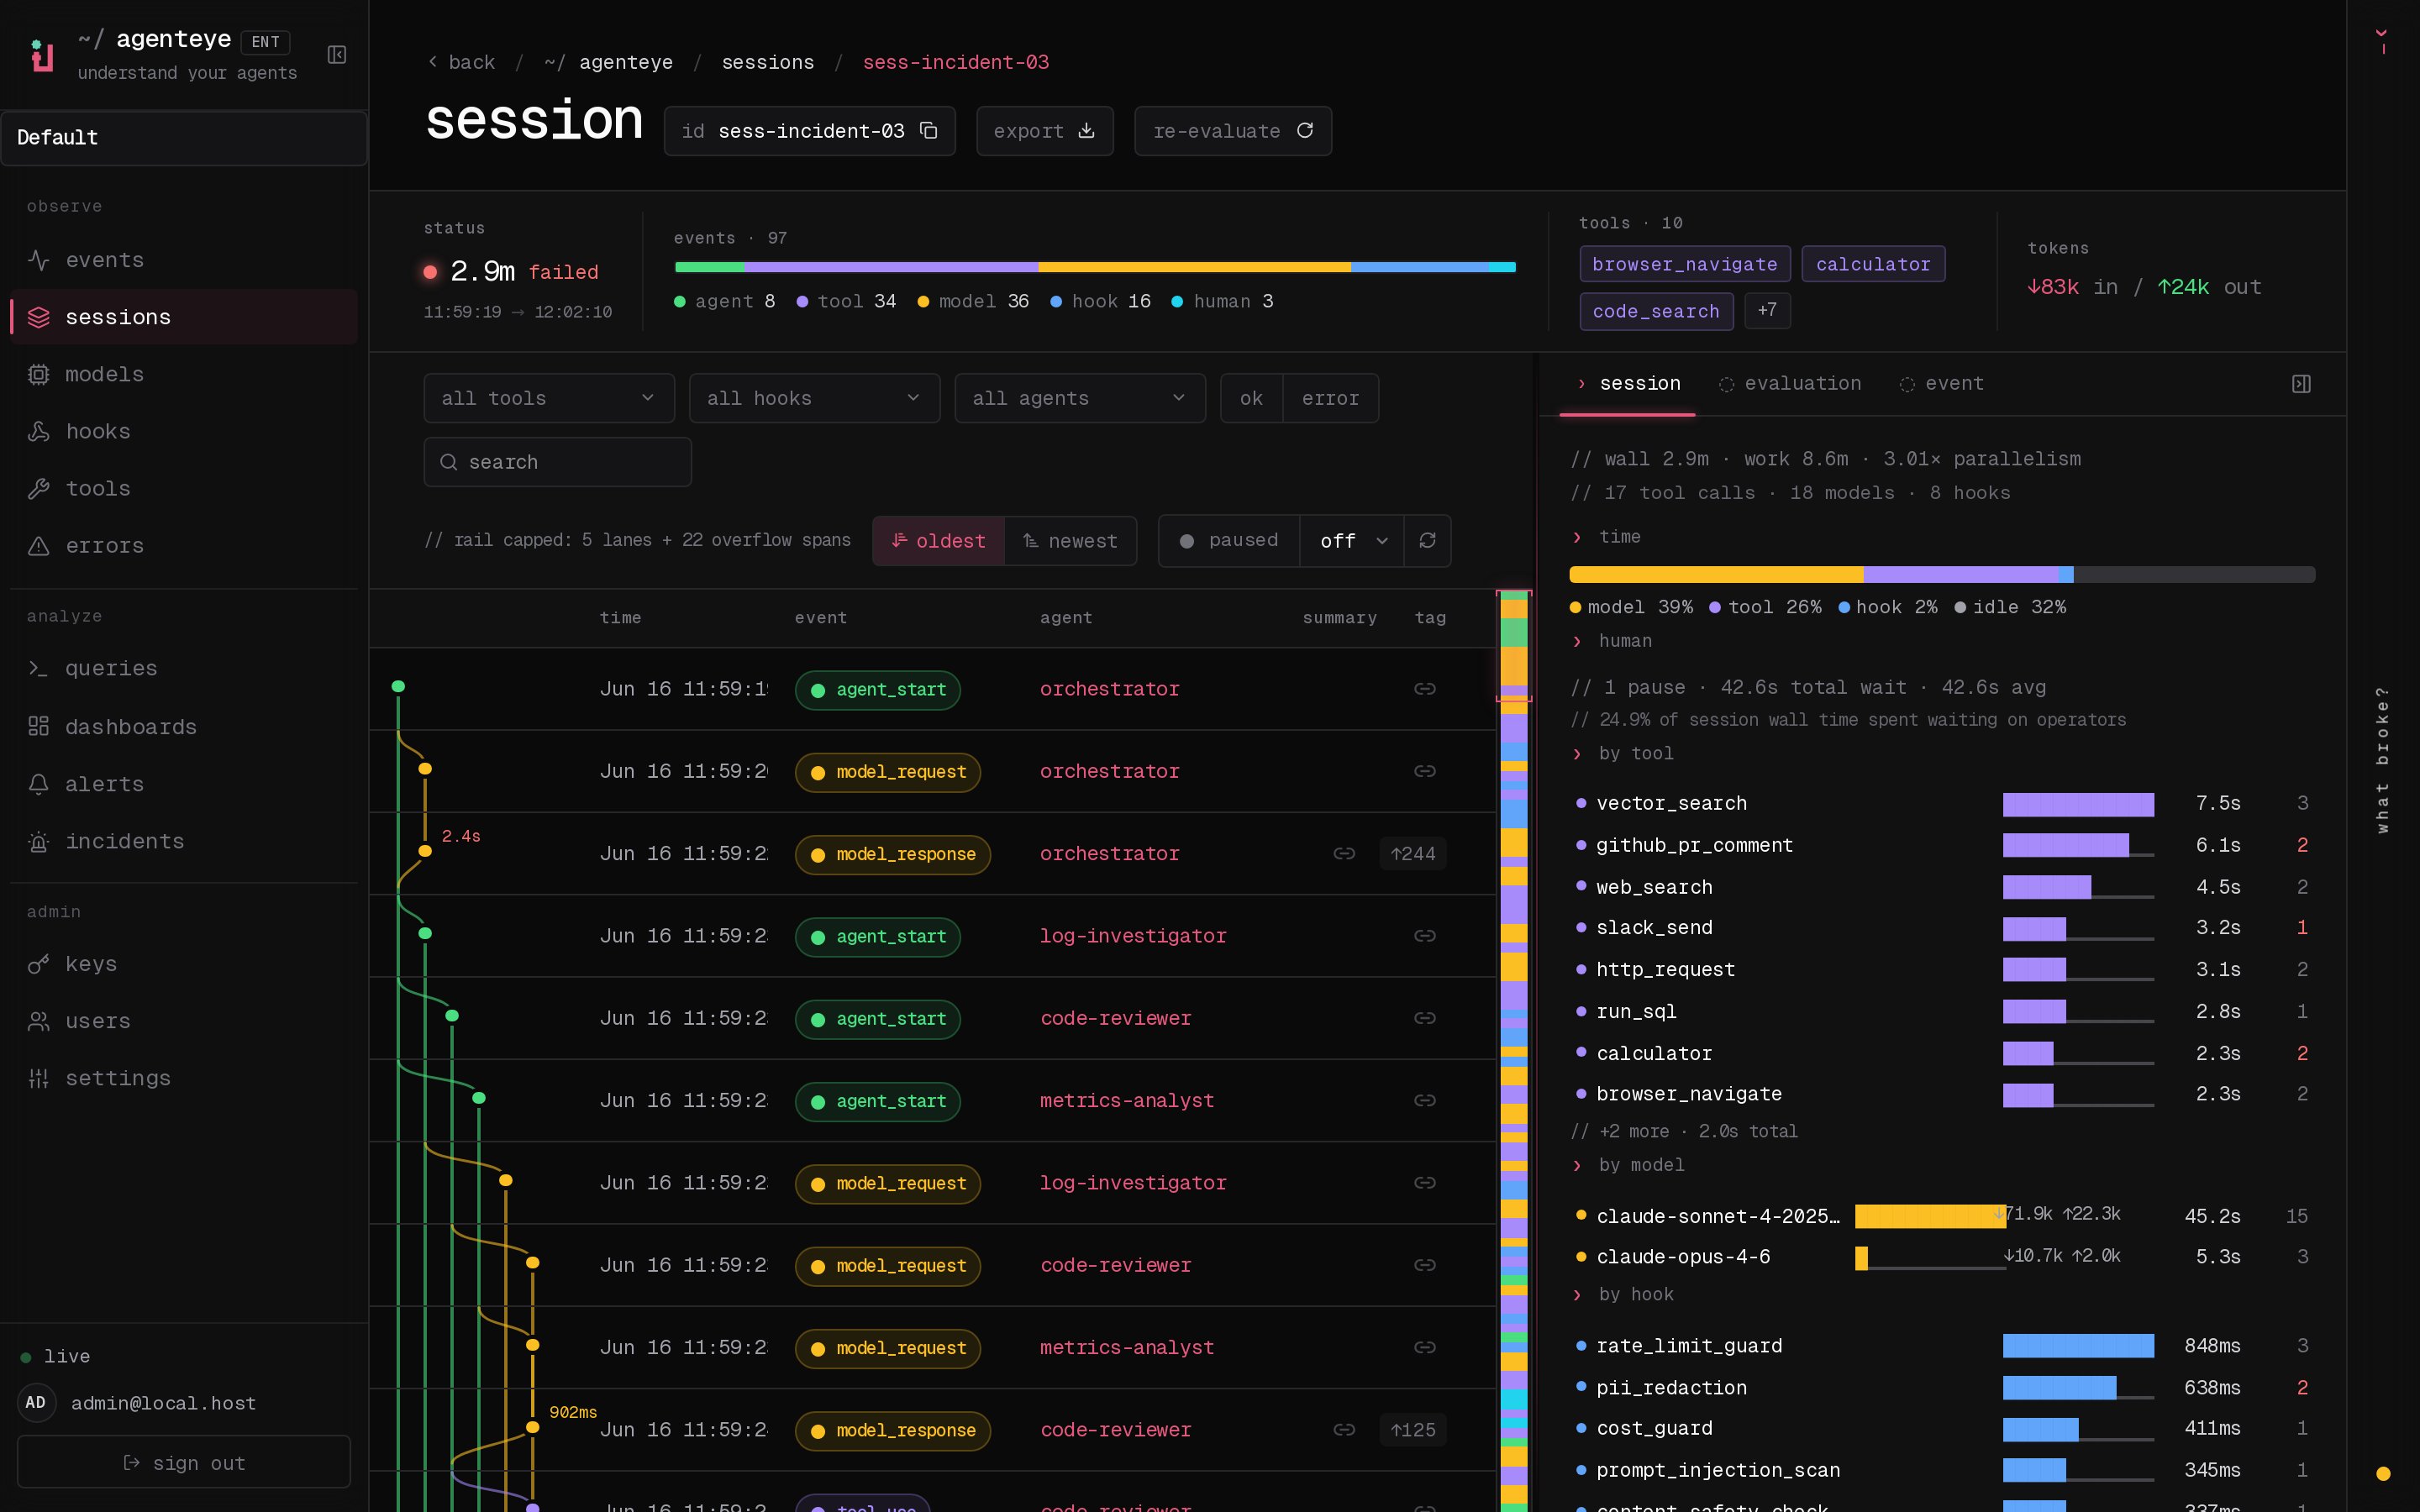
- Sessions — those events rolled up into one row per run, each automatically evaluated and scored.
- Evaluations — quality scores produced by your own evaluator services, so quality drops surface without manual review.
- Queries & dashboards — saved ClickHouse SQL over your data, charted into shared, org-scoped dashboards.
- Alerts & incidents — threshold rules that page you (email, Slack, webhook, in-dashboard) plus an incident workflow to triage them.
- CLI & AI assistant — a terminal client (
agenteye) and an in-dashboard assistant for asking questions in plain English.
Step 1: Authenticate
All AgentEye artifacts are distributed from theagenteye-enterprise GitHub organization. As an enterprise developer you can generate your own GitHub PAT. Follow enterprise-docs/github-token.md for exact steps and required permissions.
Step 2: Deploy the Server and Dashboard
The server receives events from collectors and makes them queryable; the dashboard is where you explore them. Ingested events and analytics live in ClickHouse (the required analytics store), while Postgres holds operational state such as organizations, users, API keys, dashboards, and saved queries. Download the published compose file:.env file so the deployment does not run on the default admin credential. At minimum set ADMIN_KEY and POSTGRES_PASSWORD:
ADMIN_KEY in your current shell so the later steps (e.g. the Step 3 curl) can reference it directly:
http://localhost:8080 and the dashboard at http://localhost:3000.
For production deployments (custom Postgres, TLS, reverse proxy), see enterprise-docs/deployment.md.
Step 3: Create an API Key for the Collector
Each collector authenticates with a scoped API key. Use theADMIN_KEY you set in Step 2 to create one:
key value yourself; use it in the collector config in Step 4. See enterprise-docs/api-keys.md for full key management.
Step 4: Install the Collector
On every machine that runs your AI agents, install the collector daemon. Download the binary (Linux x86_64):This downloads the Linux x86_64 build. For macOS (Apple Silicon or Intel), Linux arm64, or Docker / systemd / launchd setup, see collector-installation.md, which lists the download for each platform — the command above installs a Linux binary that will not run elsewhere.Configure:
Step 5: Install the Python SDK
On each machine where you want to instrument agent code, install the wheel from GitHub Releases.Step 6: Instrument Your Agent
Add events to your agent code. At minimum, emitagent_start and agent_end:
$AGENTEYE_HOME/events/ (or ~/.agenteye/events/ if AGENTEYE_HOME is not set) every 500 ms. The collector picks them up automatically.
See enterprise-docs/python-sdk.md for the full event API.
Step 7: View Events in the Dashboard
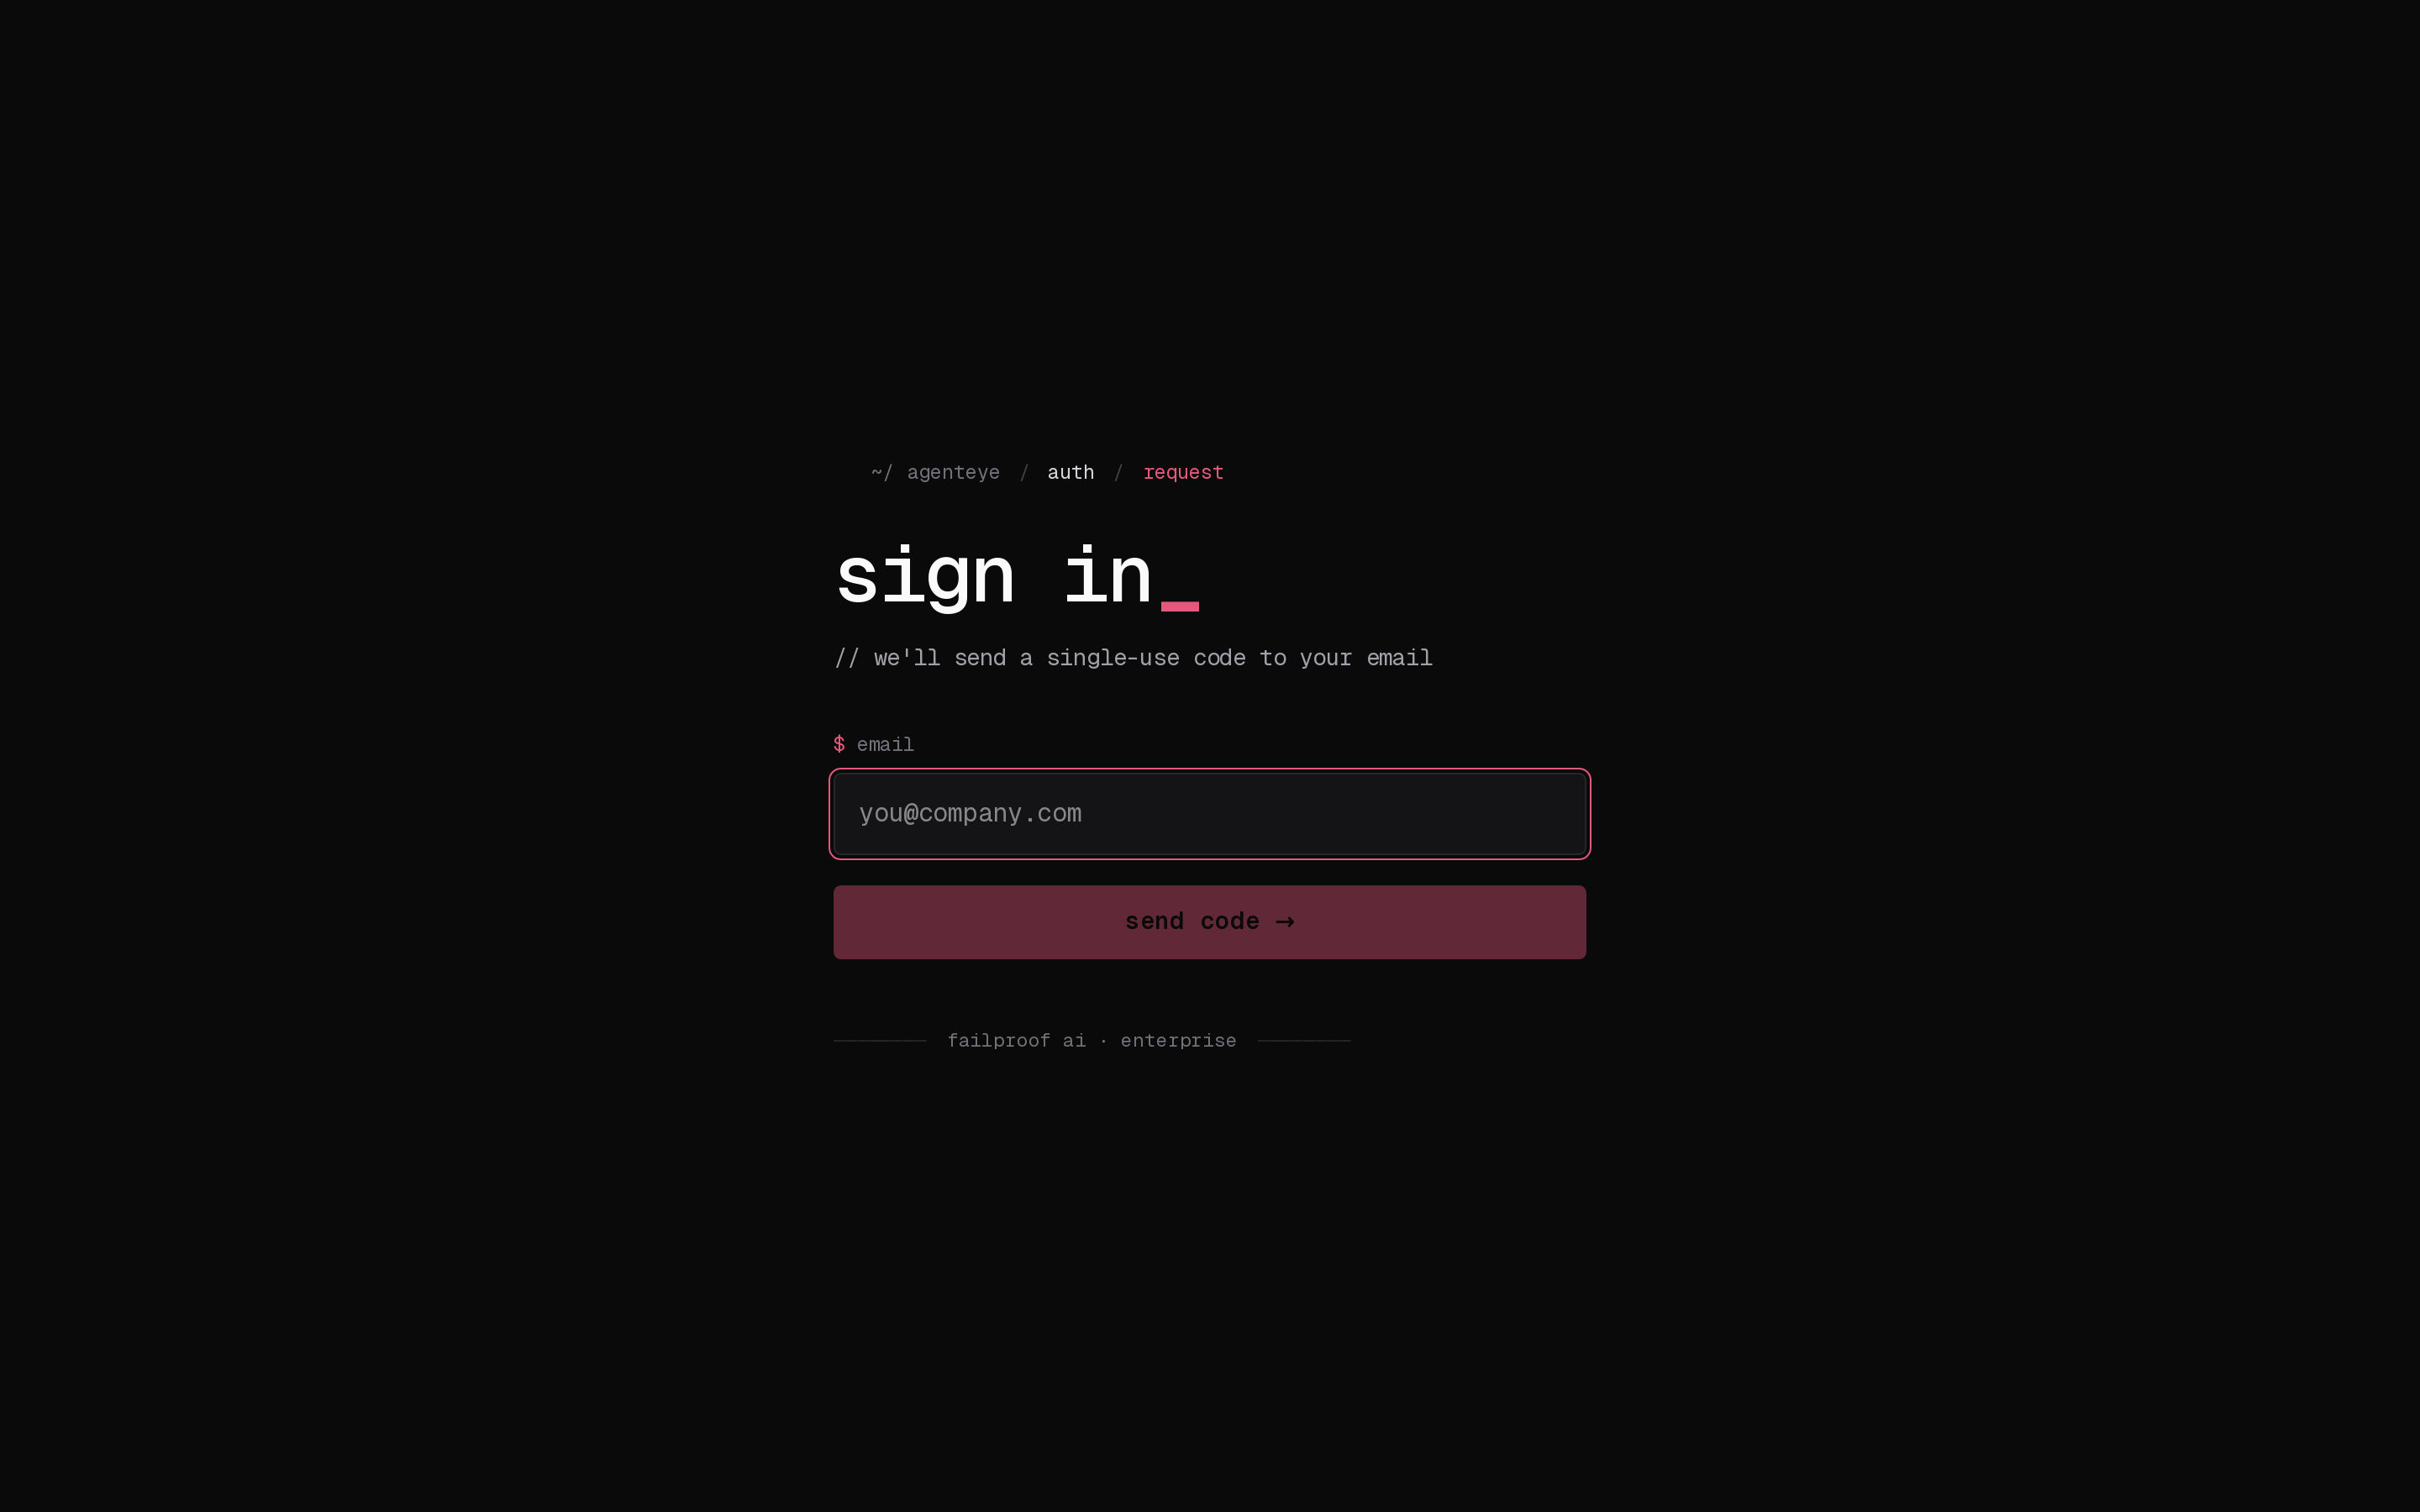
Openhttp://your-dashboard-host:3000 and sign in. AgentEye emails you a single-use code (or a one-click magic link), so there’s no password to manage.
session_id or agent_id to drill into a specific run.
Step 8: Explore, chart, and alert
With events flowing, the analyze pages turn raw activity into answers, so you can measure agent behavior, share findings across the team, and get paged the moment something regresses. Dashboard pages are organization-scoped, so the URLs you see in the address bar are prefixed with your org slug (/<org>/…).
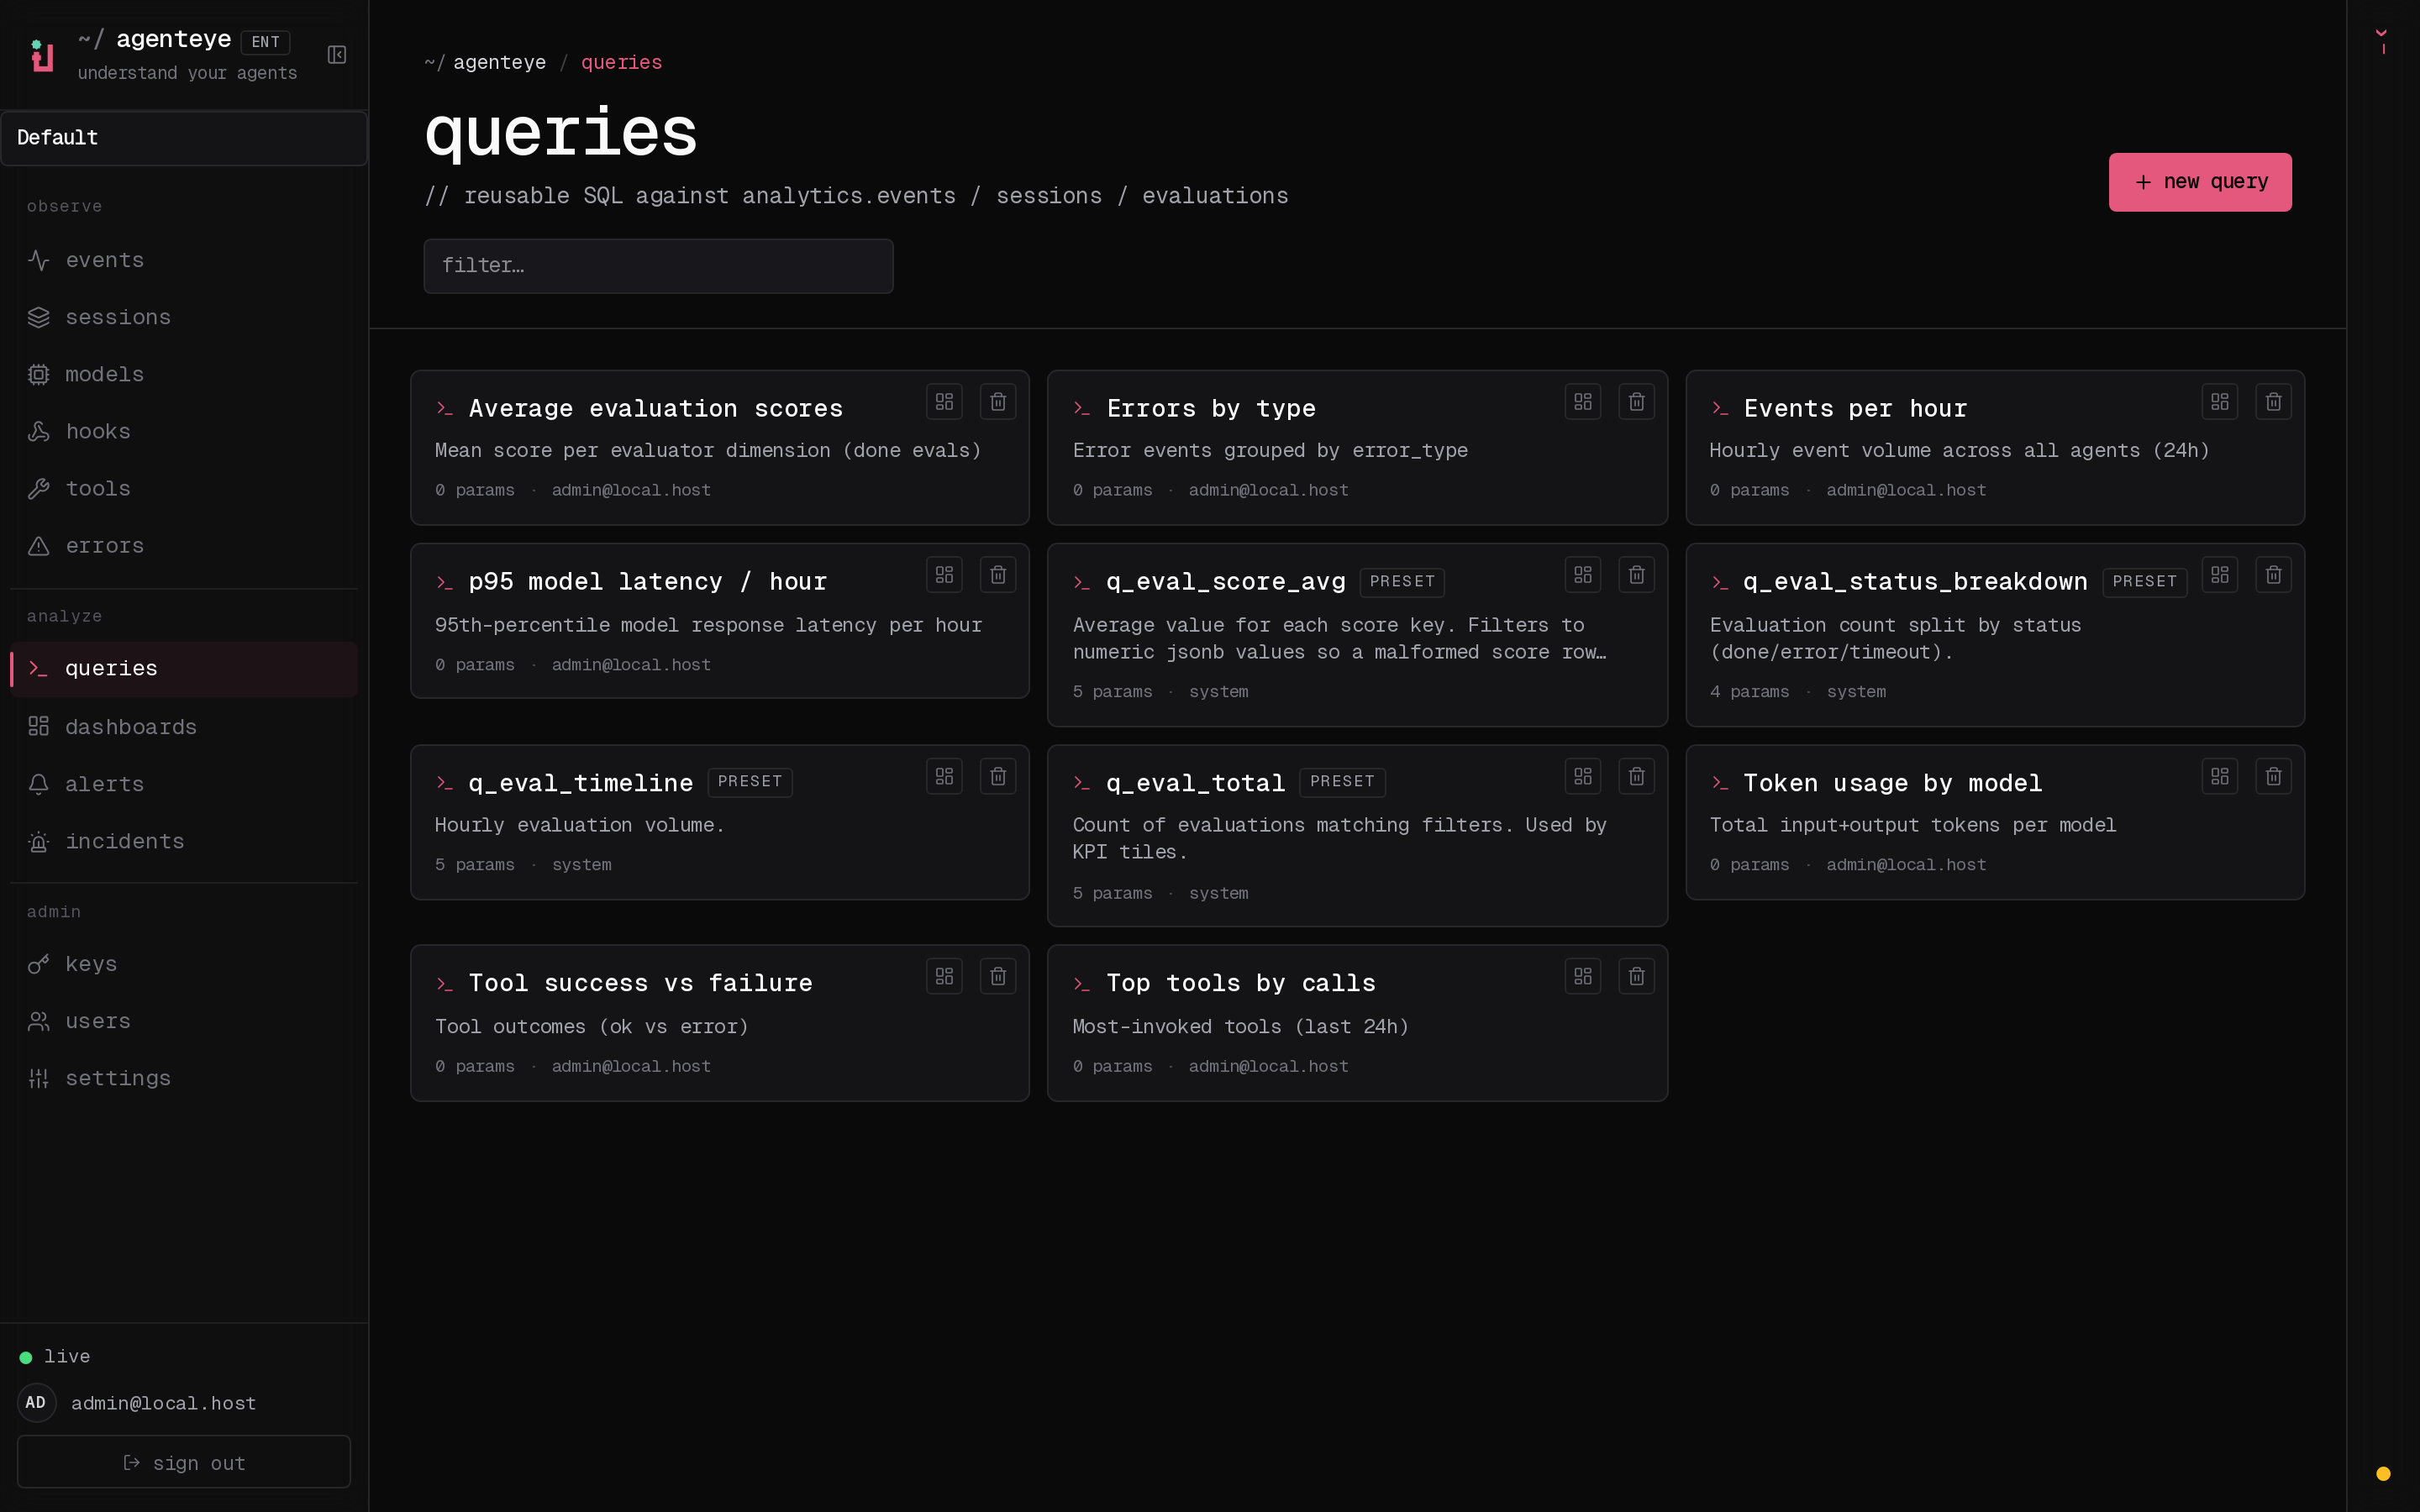
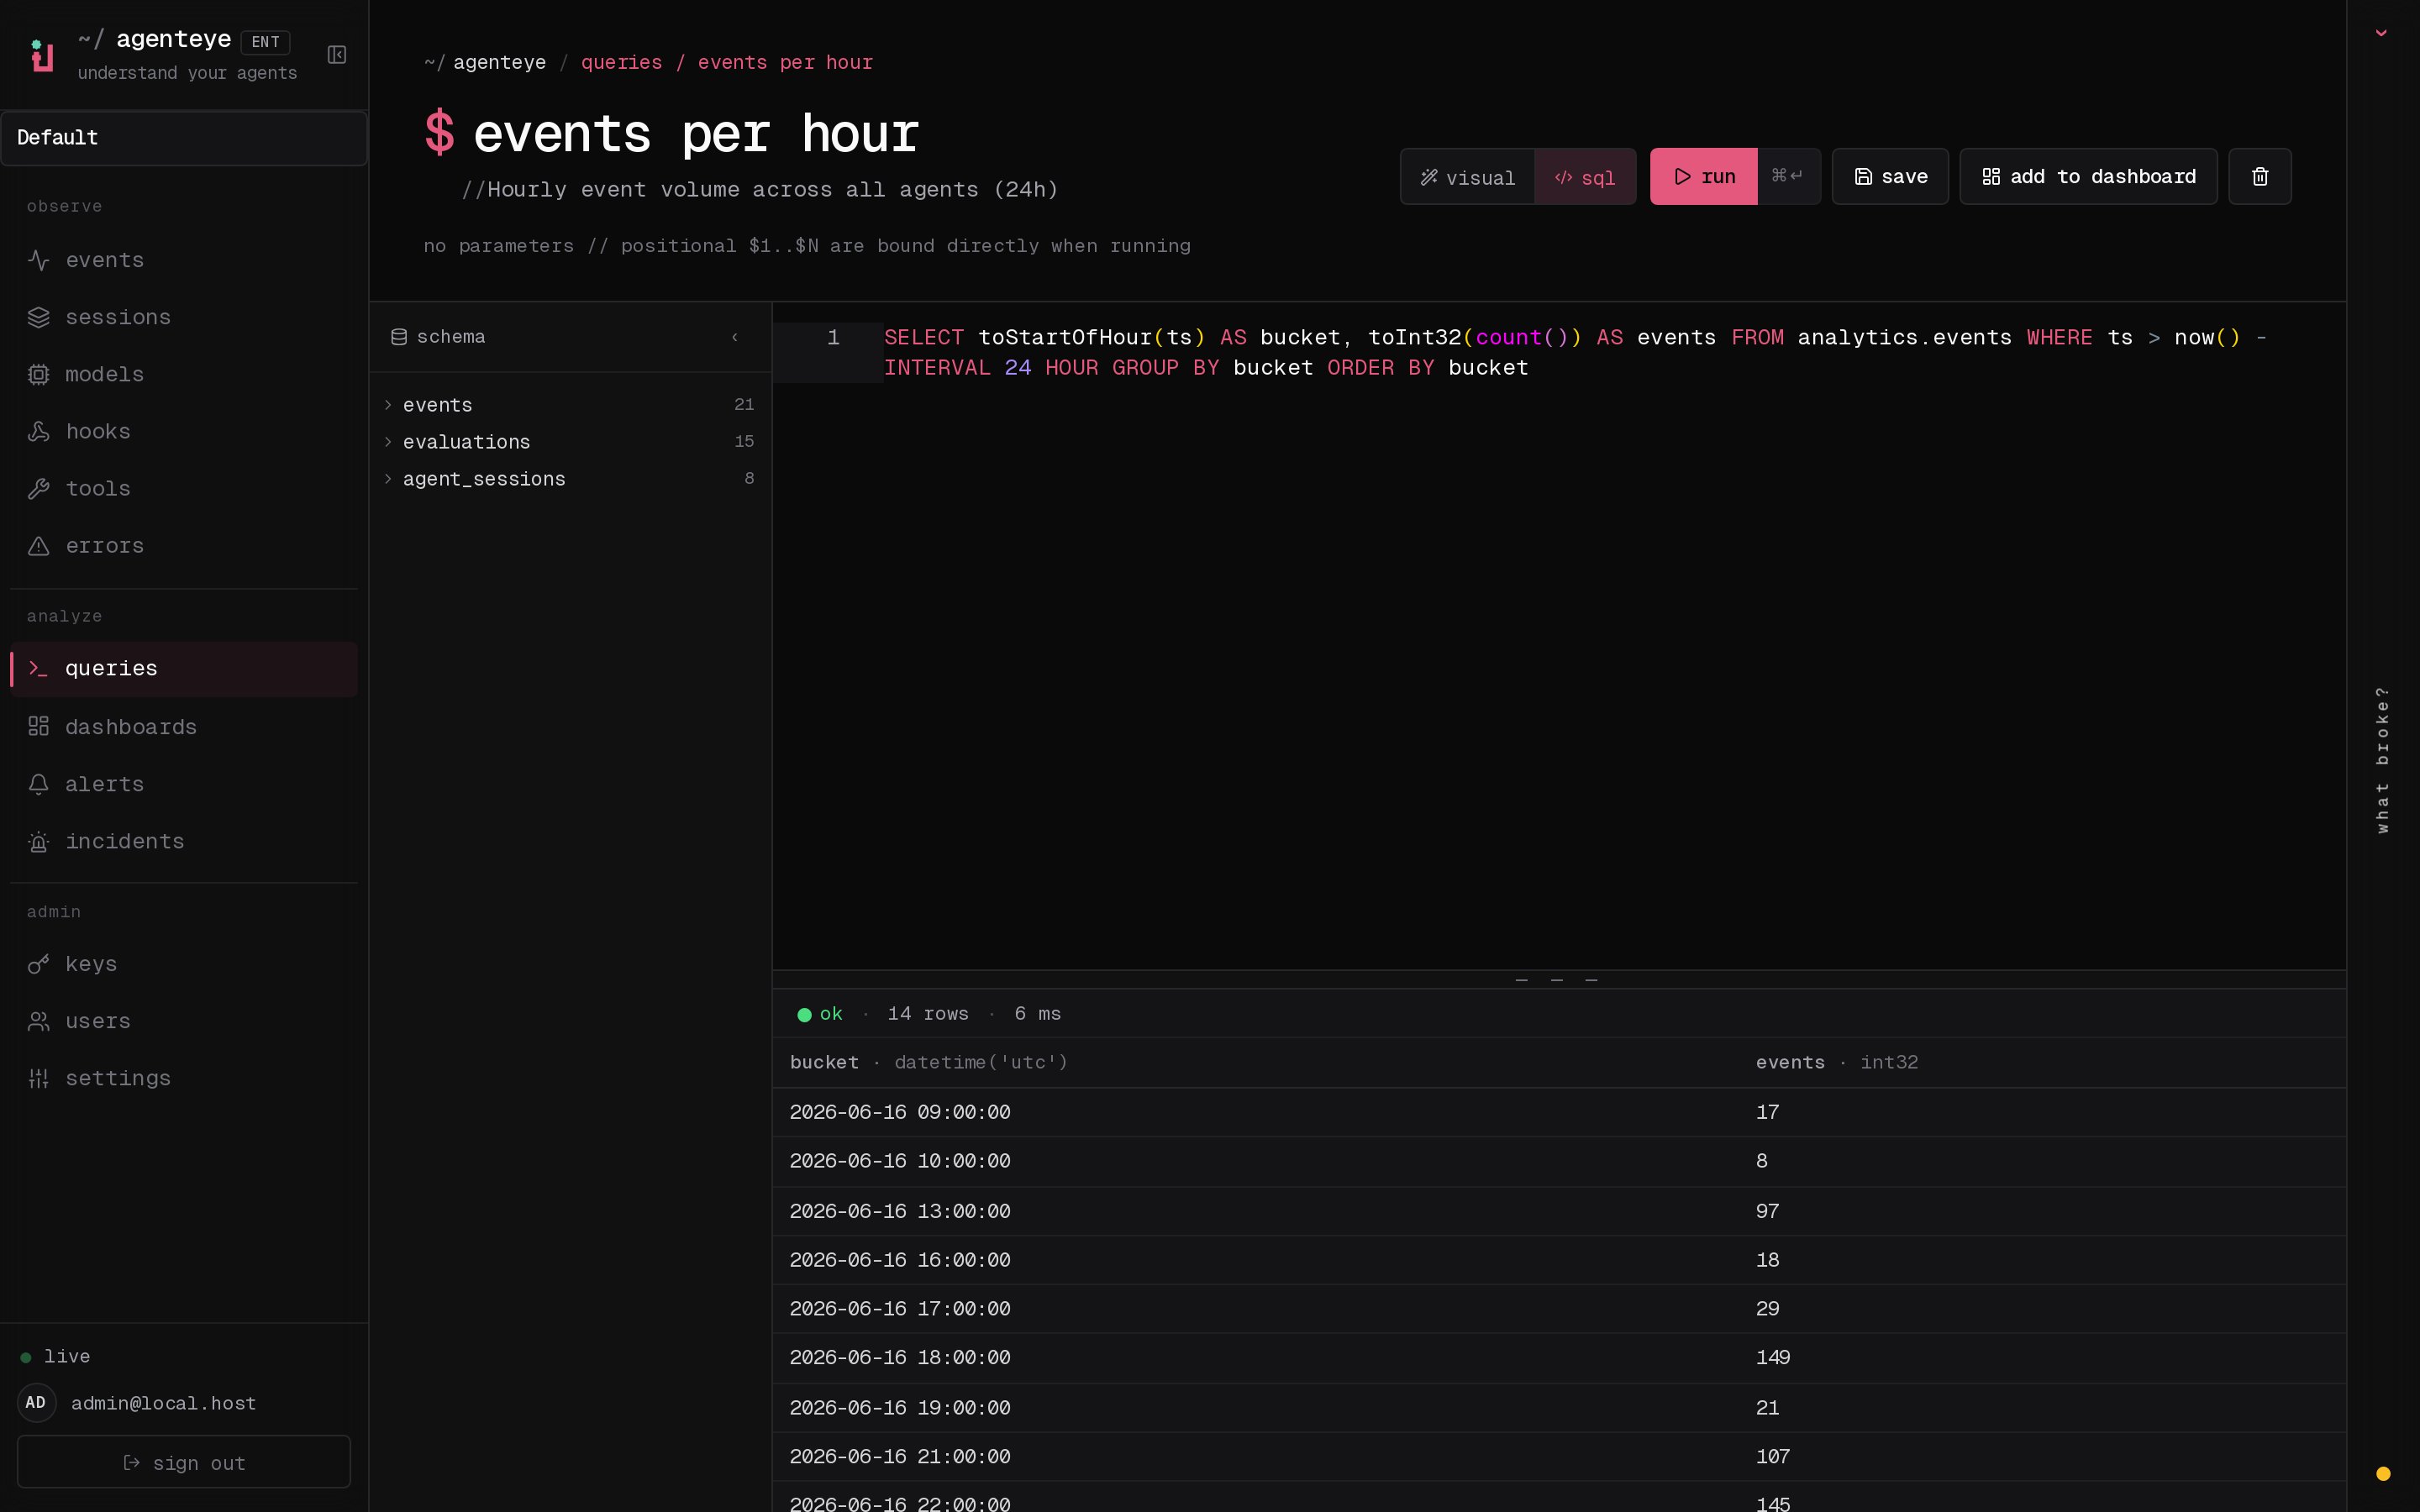
- Queries (
/<org>/queries): start from a library of saved, reusable queries over your events and evaluations (built-in presets plus your own)…
- Dashboards (
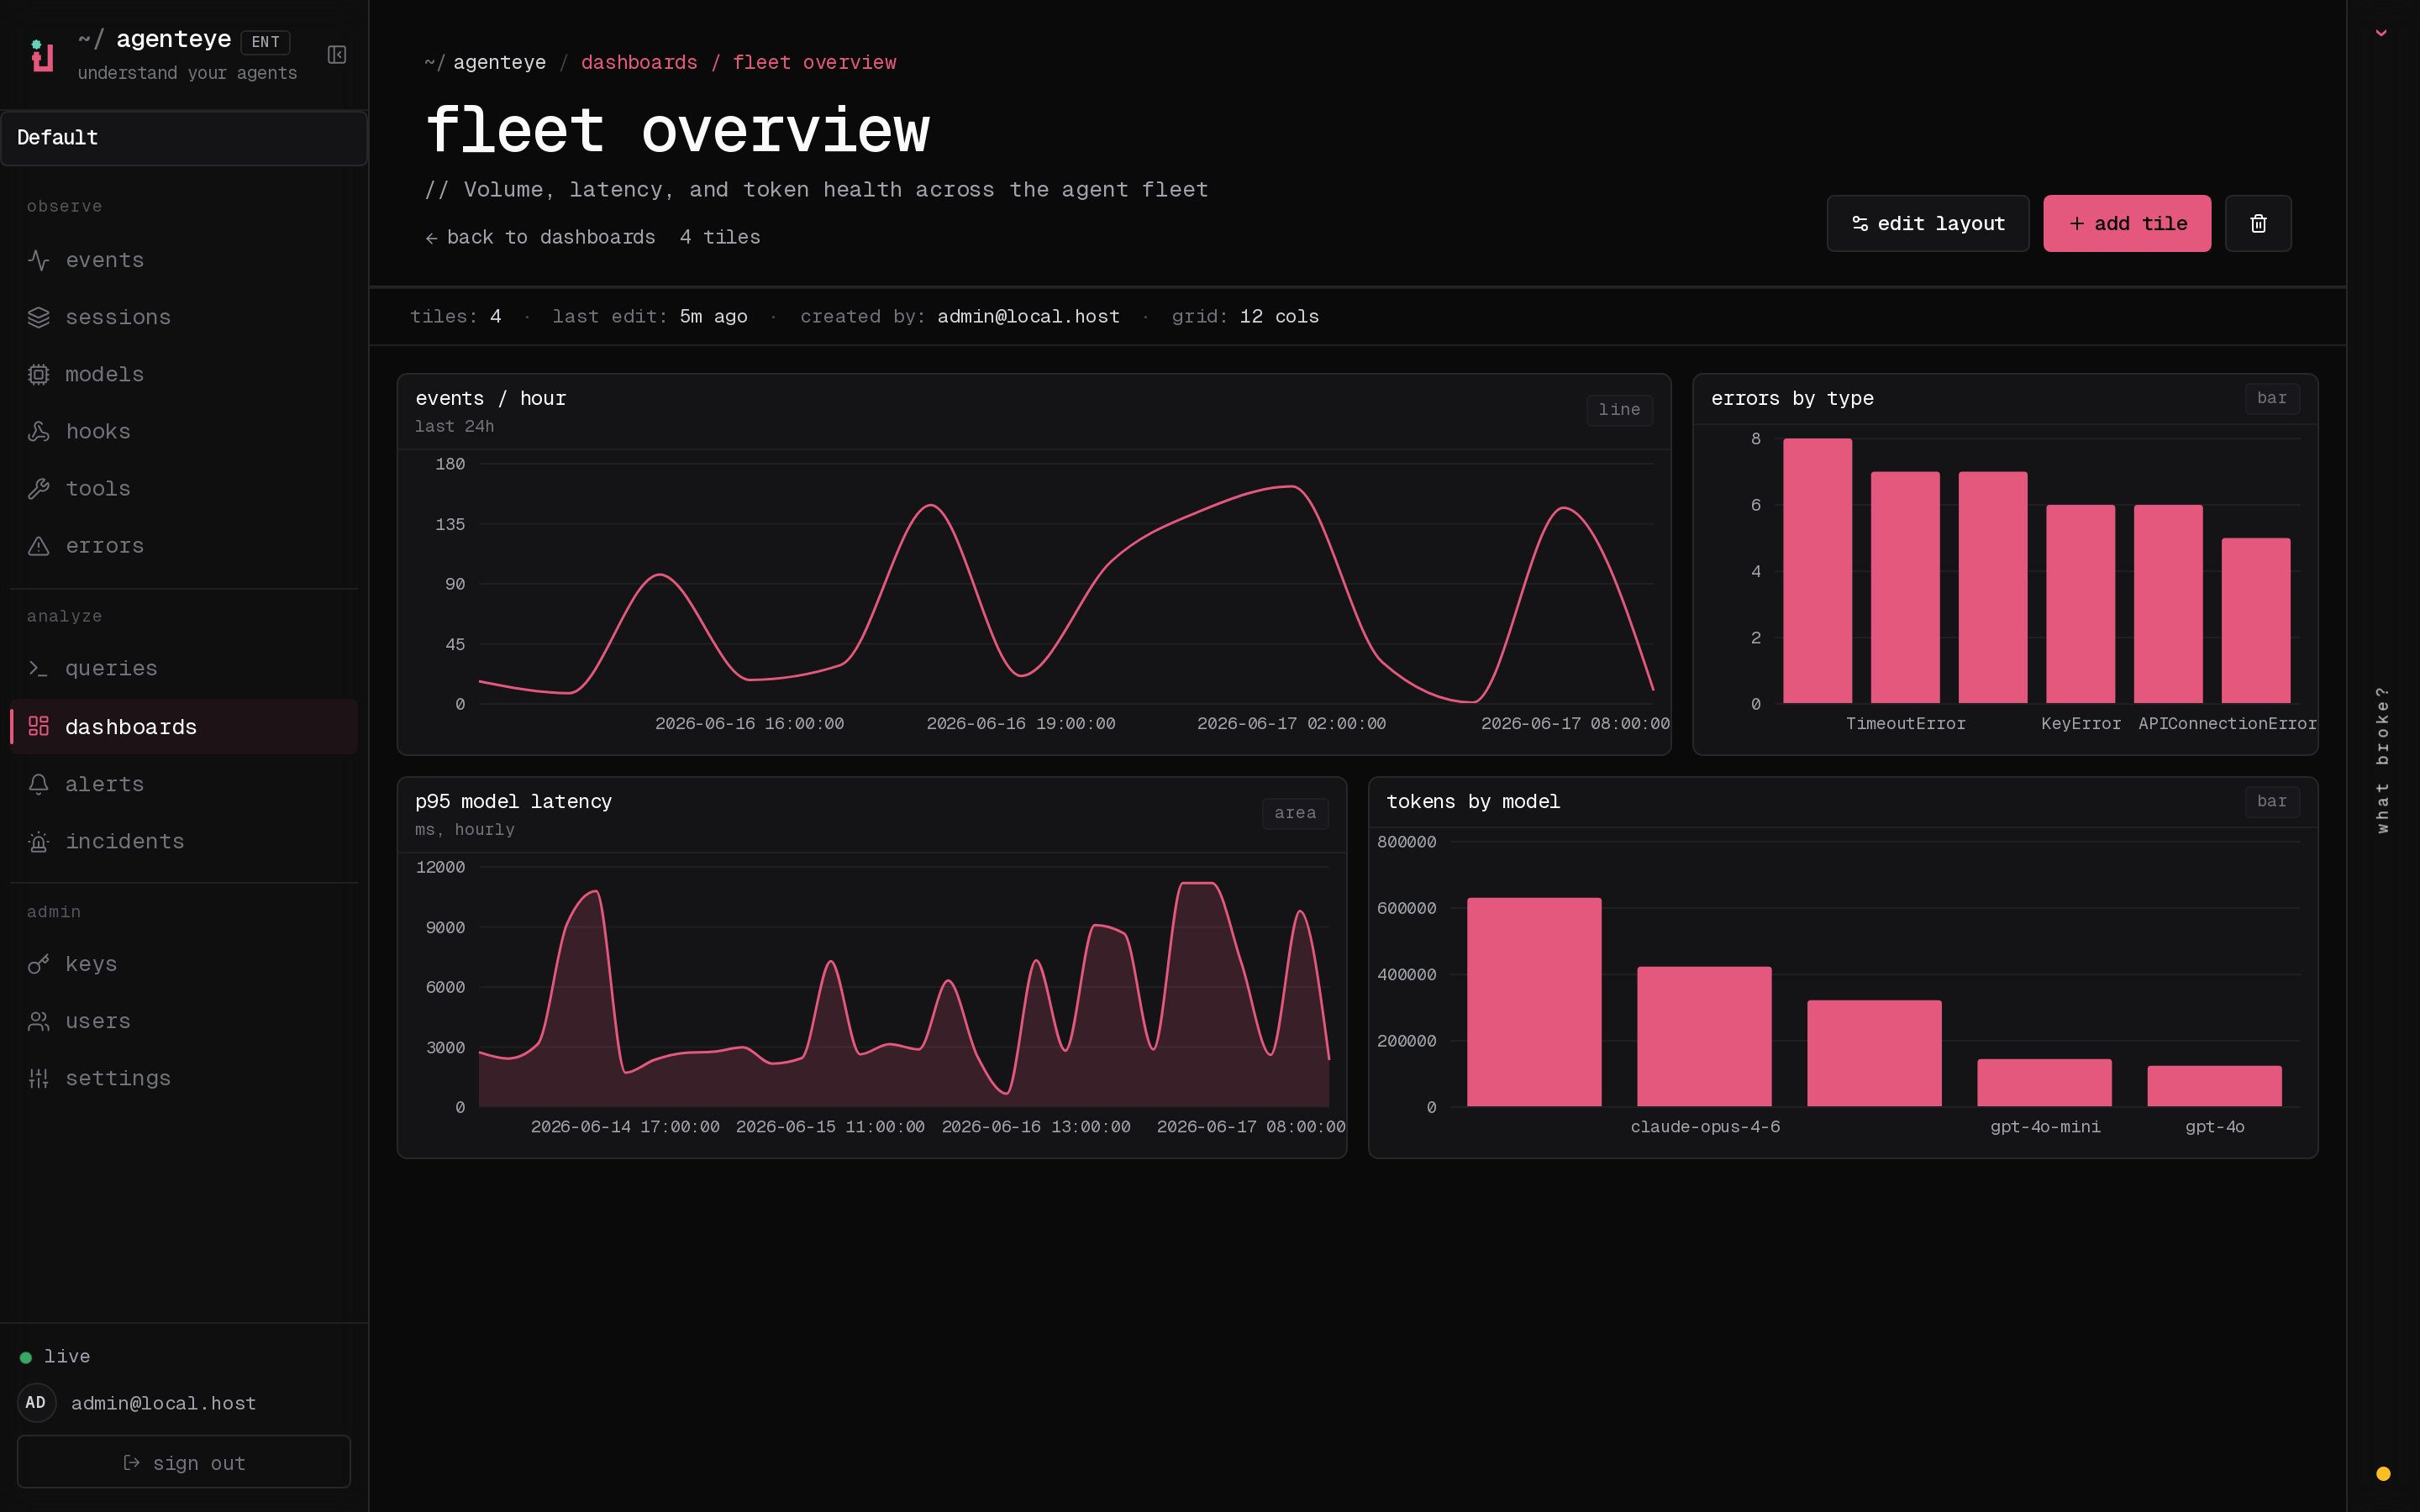
/<org>/dashboards): pin queries as line, bar, area, or pie tiles into shared, org-wide dashboards.
- Alerts (
/<org>/alerts): promote any threshold into a paging rule that notifies by email, Slack, webhook, or in-dashboard. See enterprise-docs/alerts.md.
Next Steps
- Deployment: harden for production
- API Keys: manage access
- Troubleshooting: diagnose issues