- Dashboard
- CLI
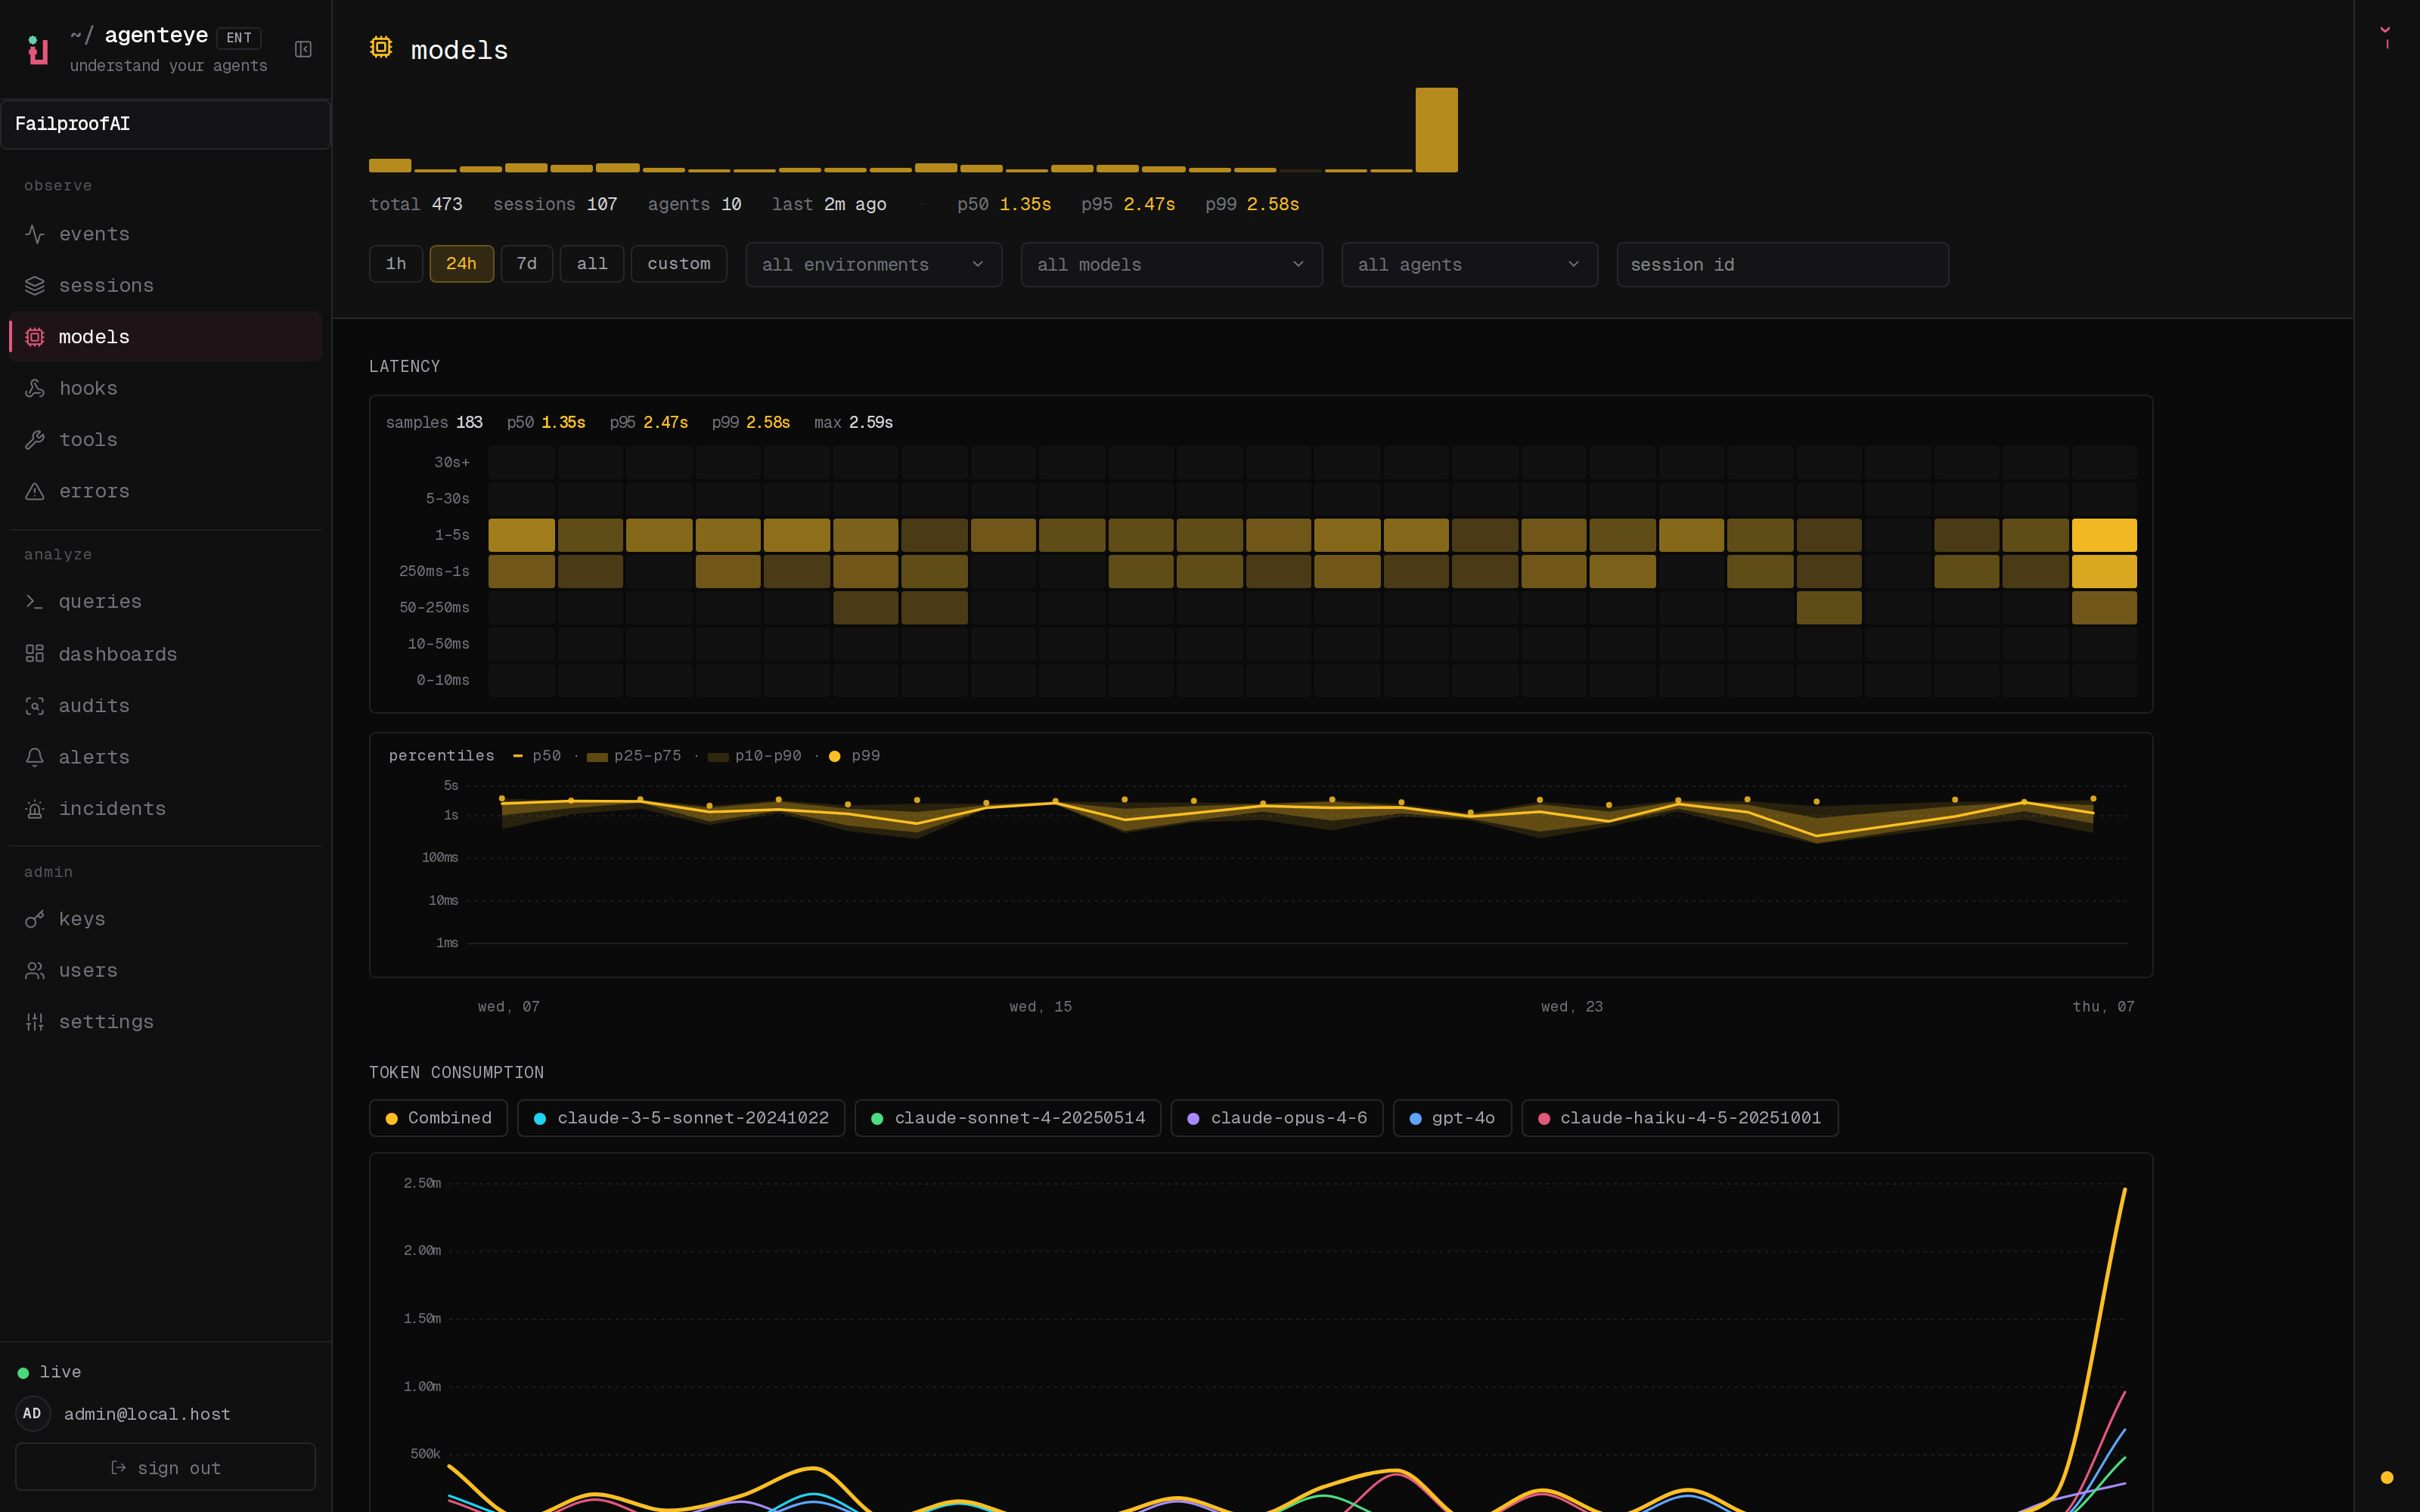
- Go to Observe → Models.
- Set the time range, then filter by environment, model, agent, or session ID.
- Review latency, token consumption, context-window use, and model distribution.
-
Select a chart point or distribution segment to open the matching events.