

Find a session
- Dashboard
- CLI
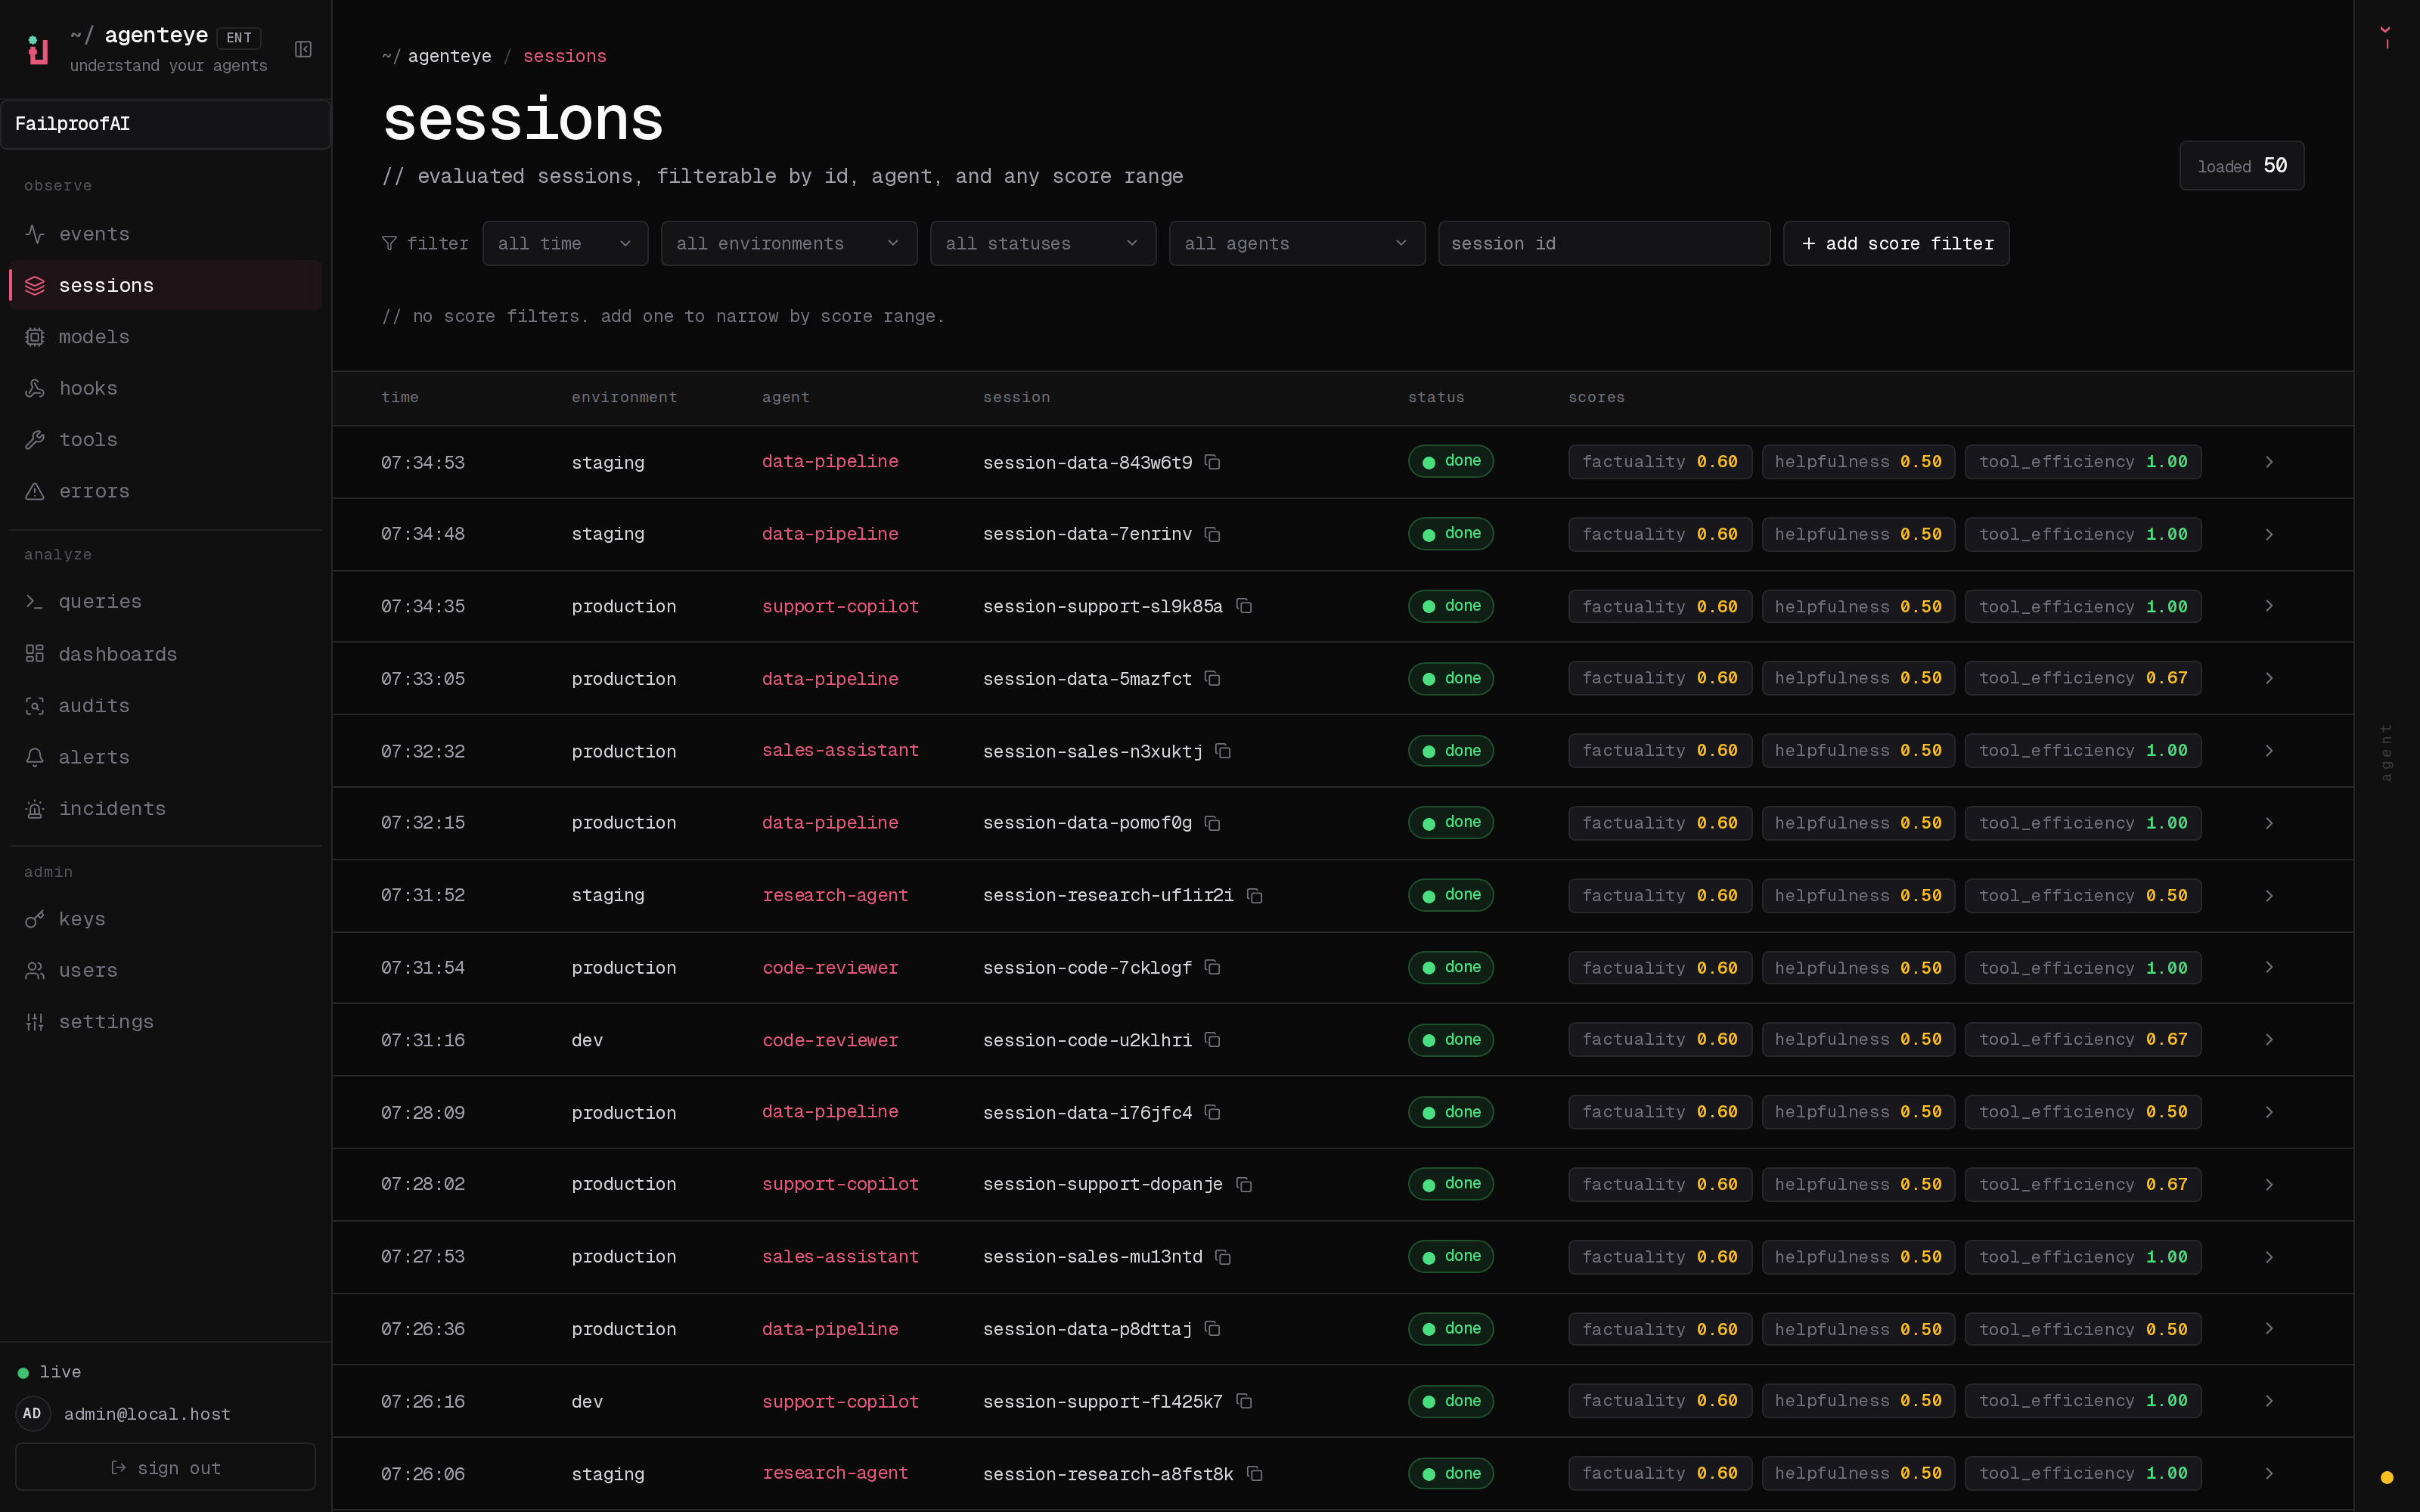
- In the Cloud sidebar, go to Observe → Sessions.
- Set the time window, then filter by environment, status, agent, or session ID.
- Add score or metric ranges when you need a quality, cost, token, or latency slice.
-
Select a row to open its trace. Use the copy control beside the session ID when sharing it.
What you can do
- Find a run by agent, environment, time, model, event type, or error state.
- Follow the exact sequence that produced an outcome.
- Compare successful and failed runs.
- Open the evidence used by an audit finding or alert incident.
- Export a session when you need an offline record.
A reliable investigation order
- Confirm the session goal and environment.
- Find the first error or unexpected decision—not only the final failure.
- Inspect the model context and tool input immediately before it.
- Check retries, latency, and human interruptions.
- Review evaluation scores and policy decisions.
Read a trace
Learn how to move from the session summary to the event that caused the outcome.