

Open the trace
- Dashboard
- CLI
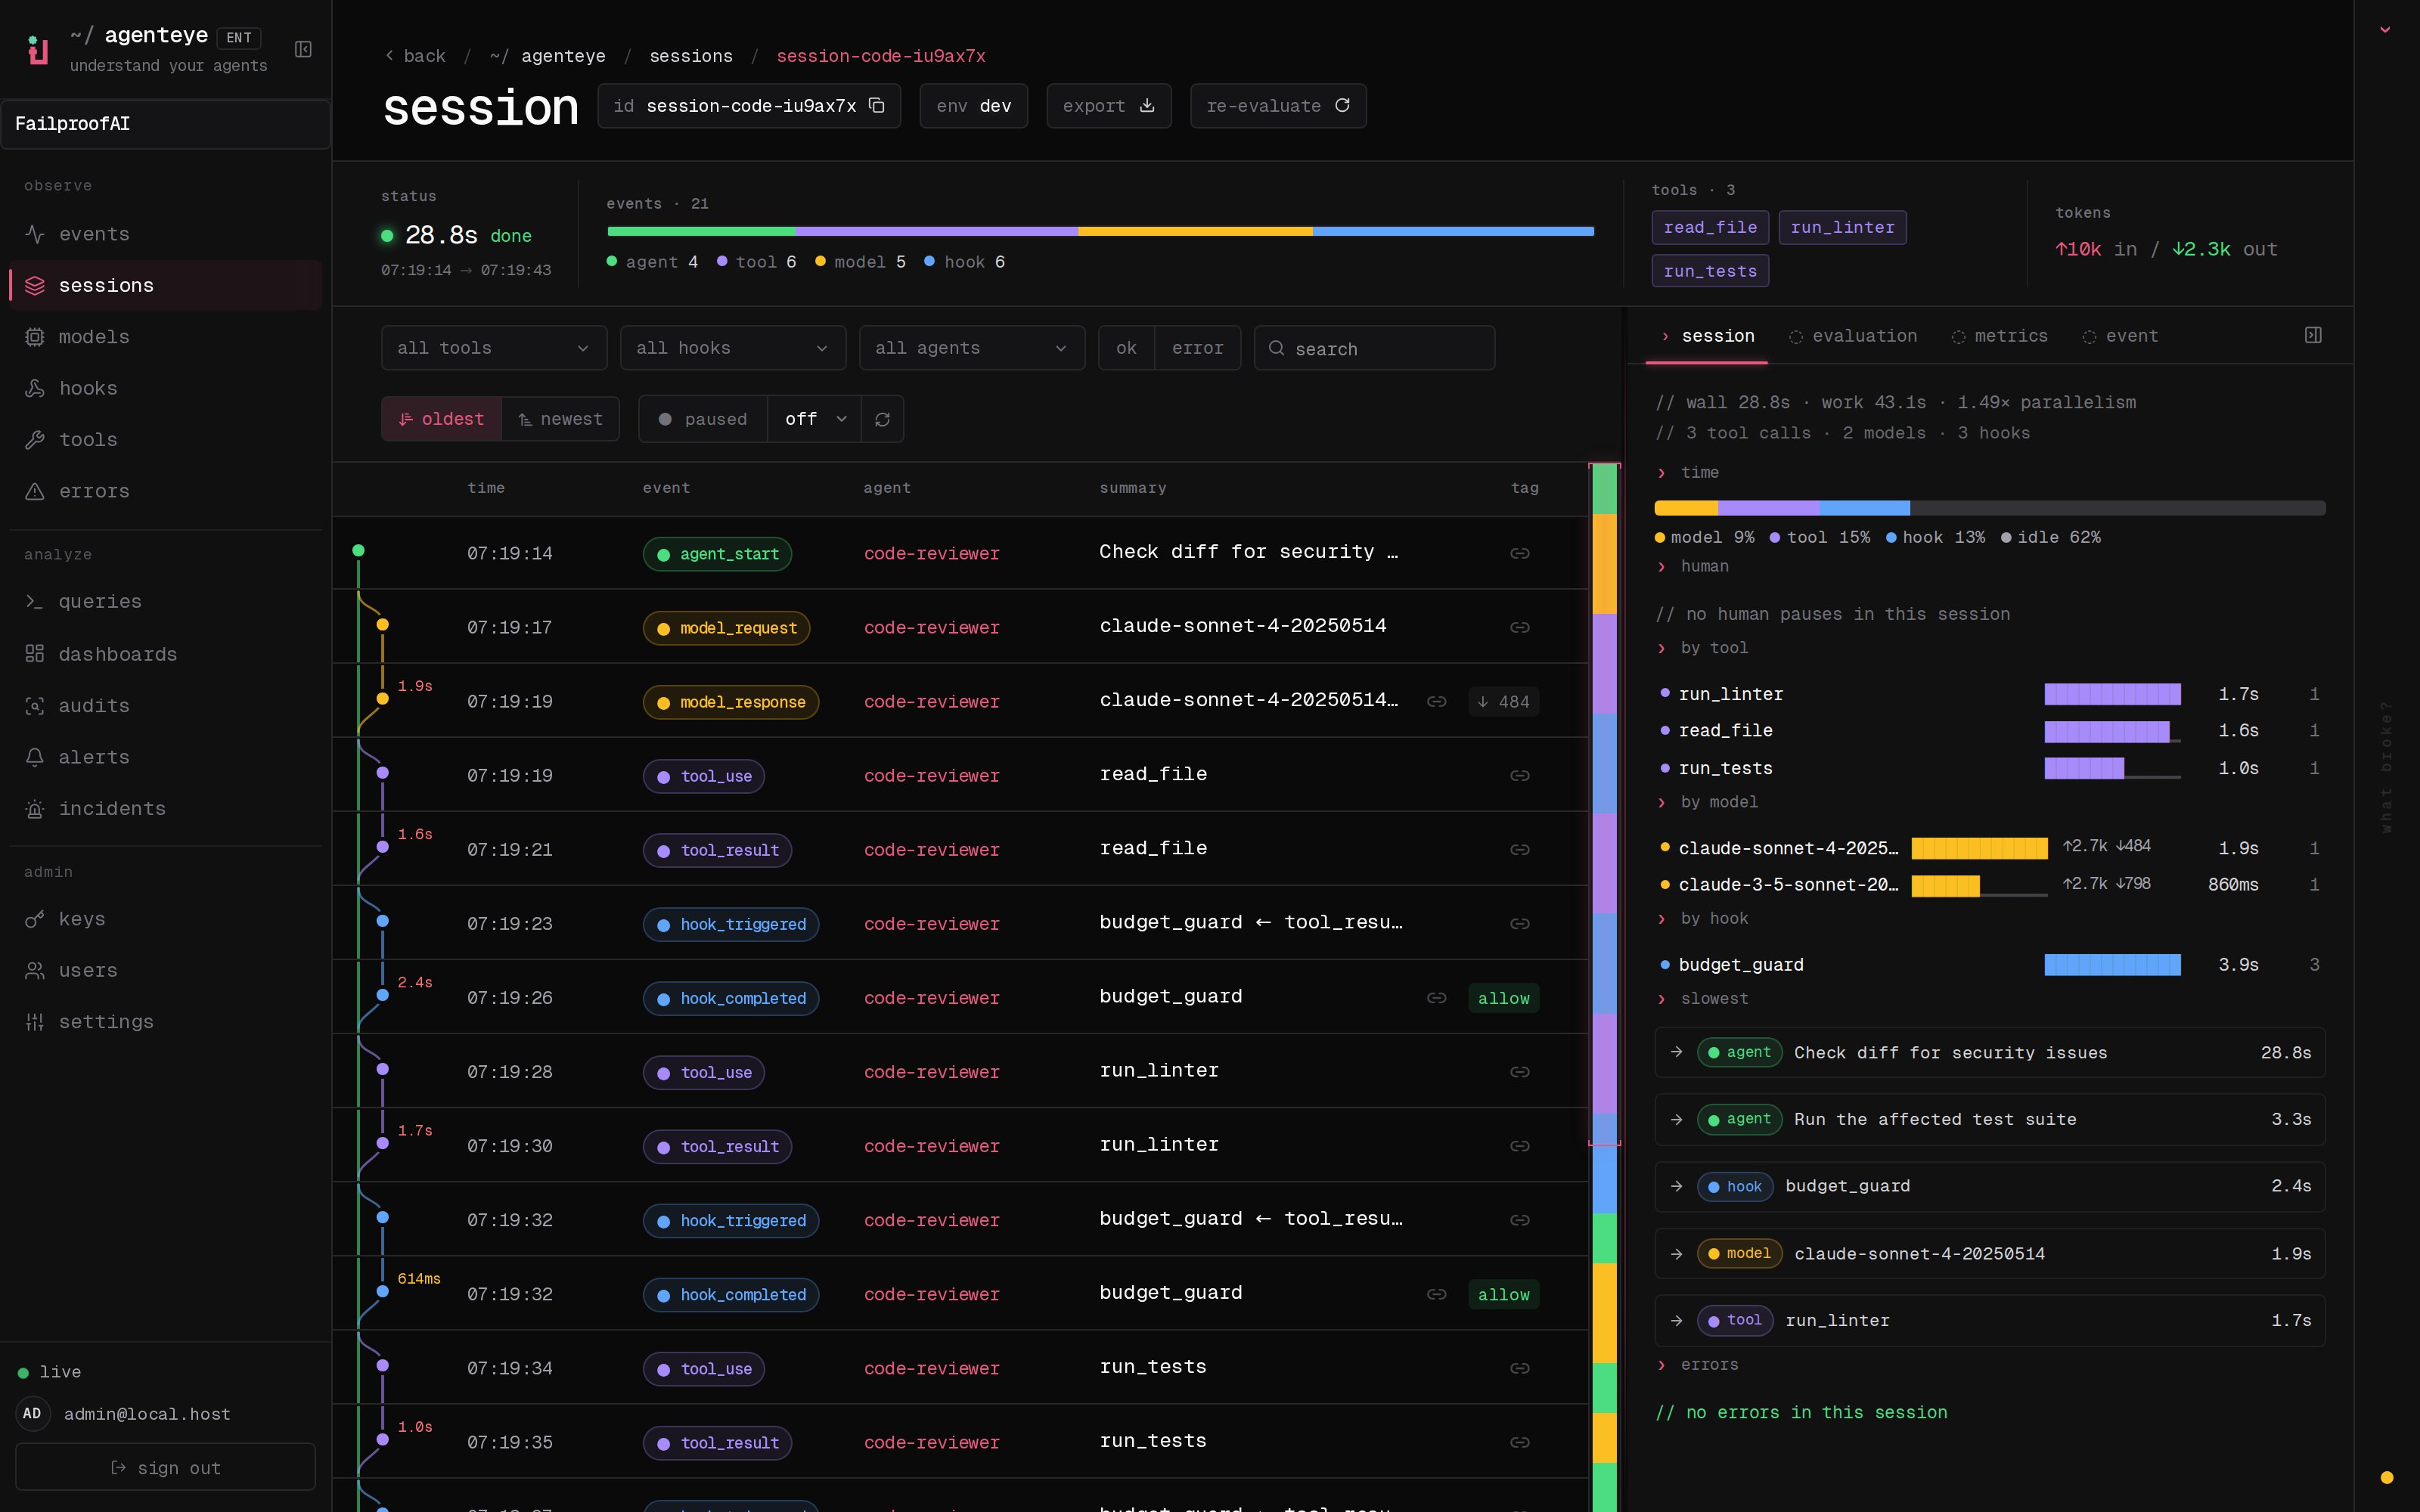
- Go to Observe → Sessions and open a session.
- Use the profile summary to check outcome, timing, errors, and evaluation scores.
- Scan the timeline and minimap. Filter event types or time when the session is large.
-
Select an event to inspect it. Use export for evaluator JSON, or copy the page URL to share a deep link to the selected evidence.
1
Orient yourself
Confirm the agent, environment, timing, outcome, and duration, then scan for errors, long spans, repeated tools, human waits, and denied policy decisions.
2
Expand the first suspicious event
Inspect its request, response, tool input, output, and correlation ID. Sensitive content is visible only when transcript capture is enabled and your permissions allow it.
3
Inspect the preceding context
The cause often sits one event earlier: an incorrect model response, missing tool result, or stale assumption.
4
Turn the evidence into action
Add the session to an audit scope, link it to an issue, or use the failure mode to author a policy.