

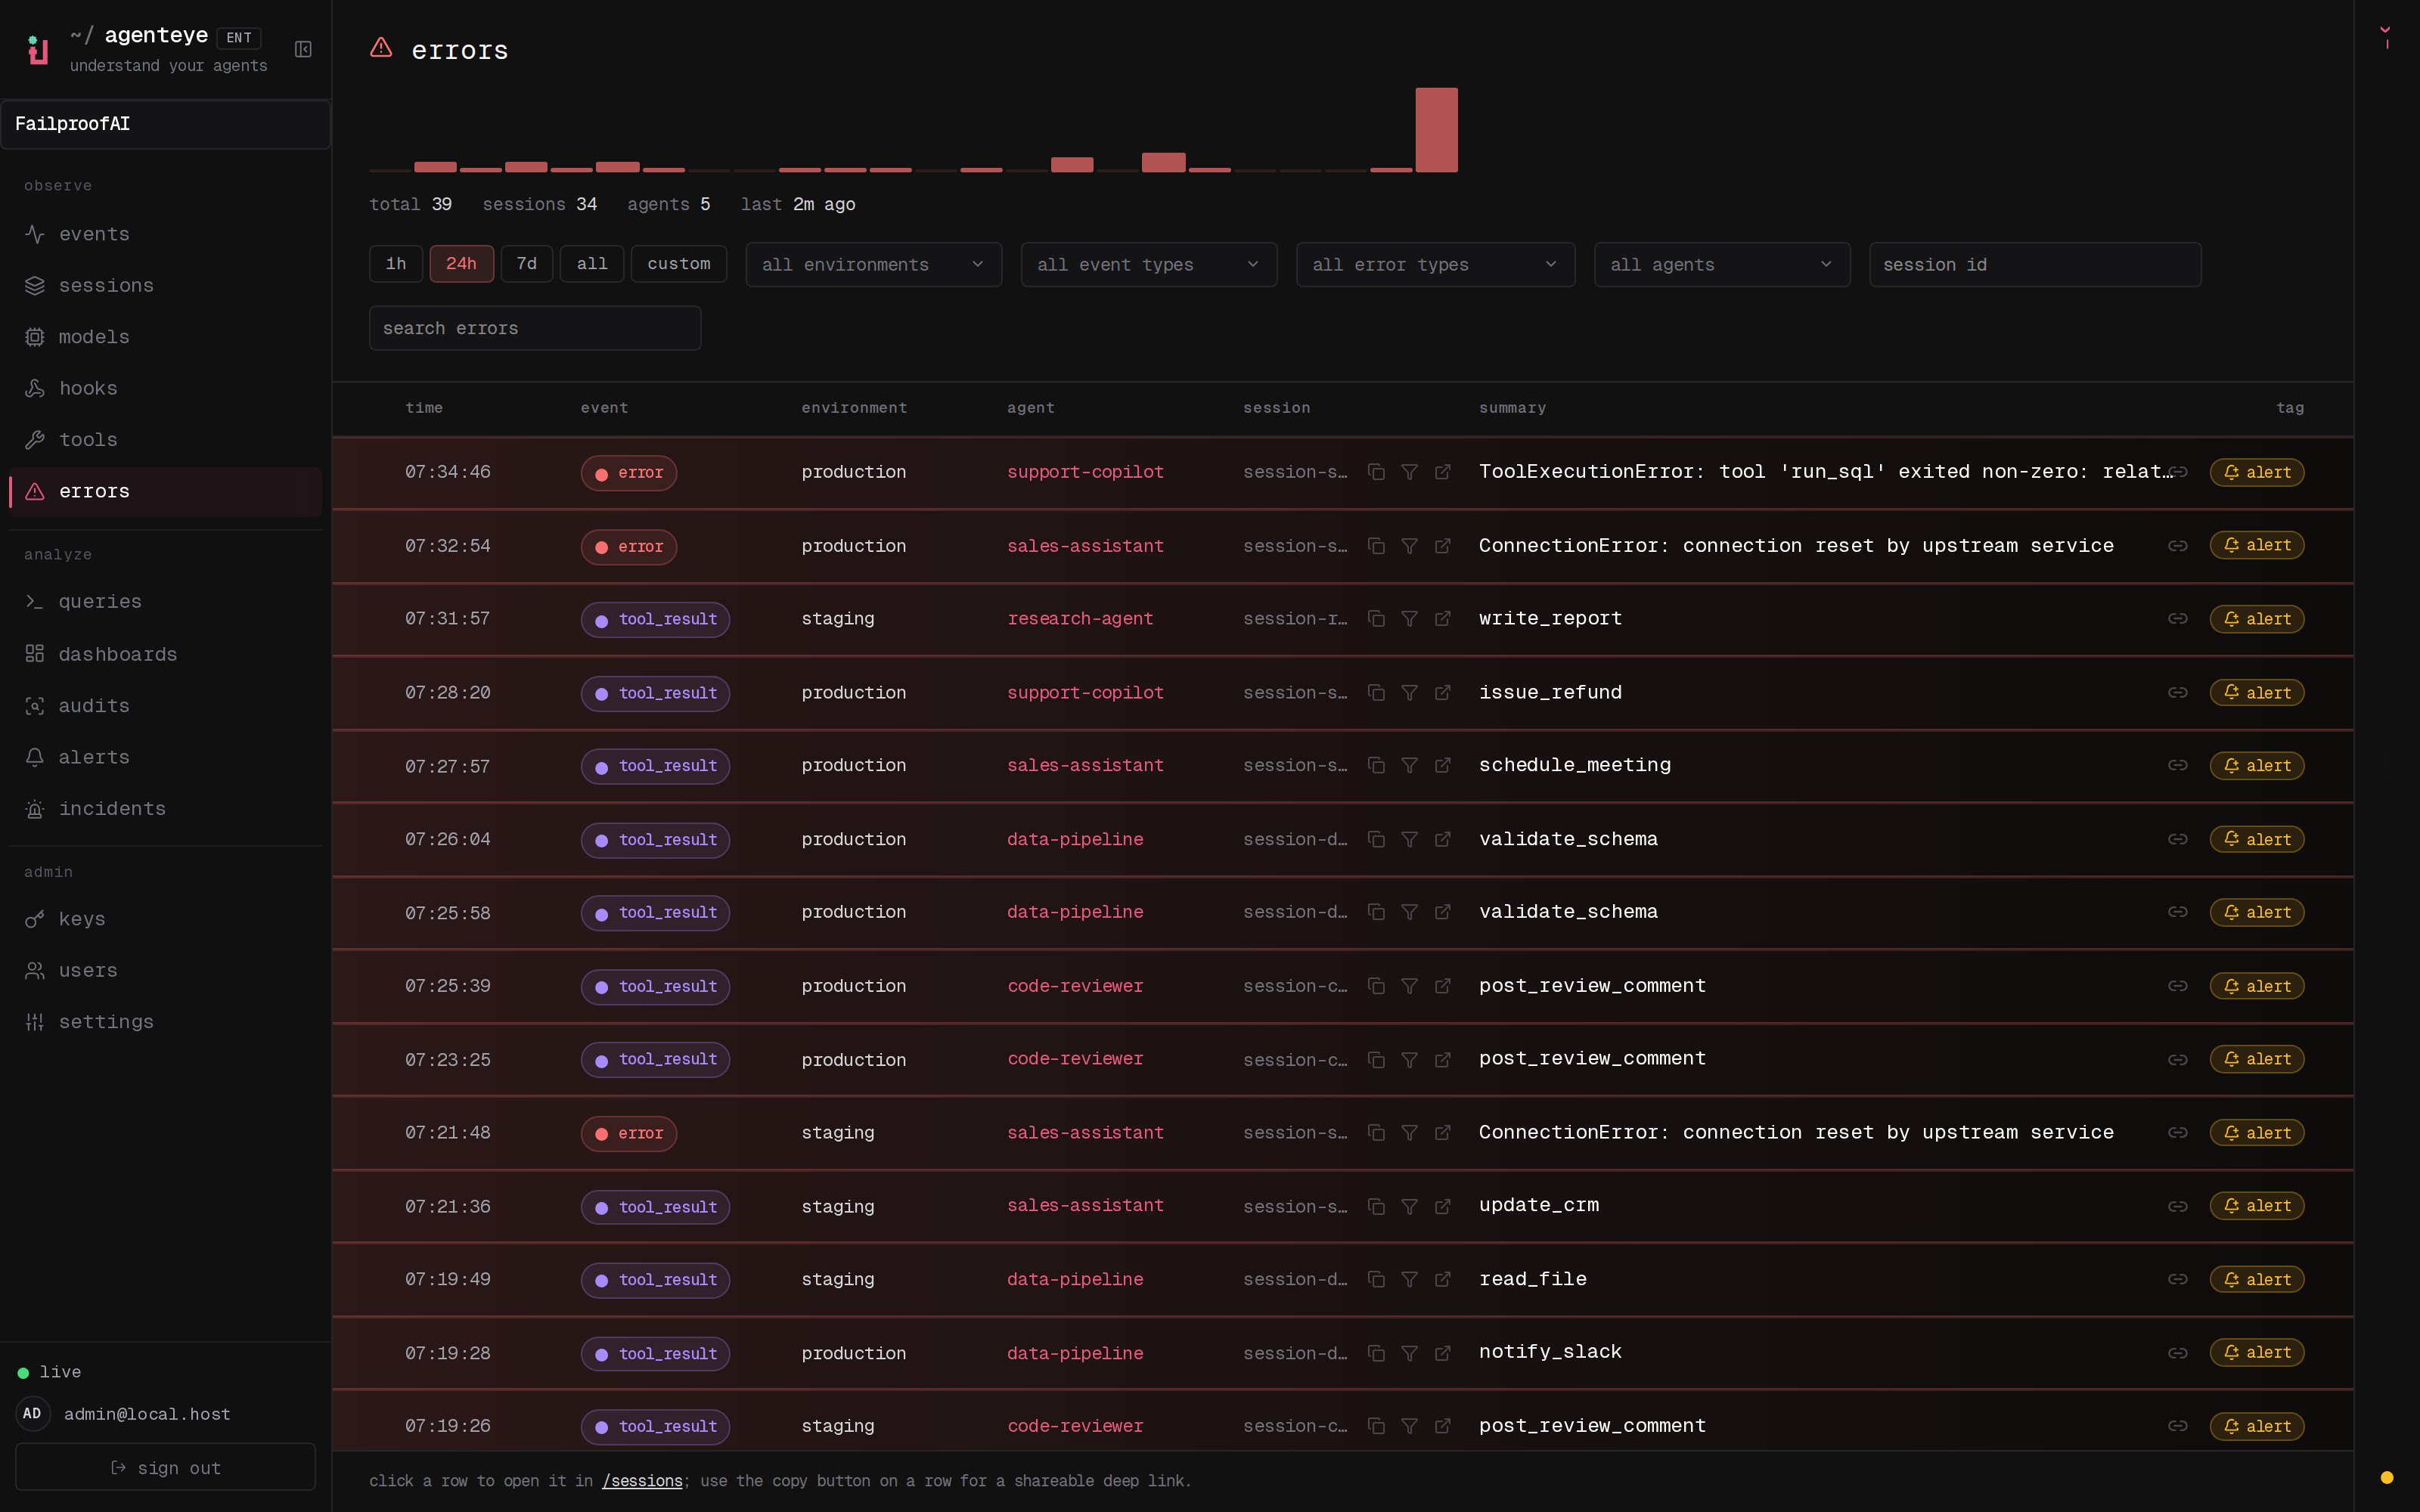
Every failure, already collected for you
When an agent breaks, you should not have to scroll a live event stream hoping to catch the red rows before they scroll away. The Errors page does the collecting for you. It pulls together everything the dashboard would paint red into one triage surface, so the first thing you see is what is failing, not where to go looking for it. And it catches more than the obvious ones. Alongside expliciterror events, FailproofAI Observability surfaces the quiet failures too: any tool_result, hook_completed, or agent_end whose payload carries a failure shows up here. A tool that returned an error, or a hook that exited badly, no longer slips past you just because nothing threw a loud exception.
Across the top, a histogram plots errors over time. One look tells you whether this is a steady background trickle or a spike that started a few minutes ago, so you know right away whether to drop what you are doing.
Like every observe surface, the Errors page is scoped to your organization and filters by date range, environment, agent, and session. That means you can take a fleet-wide list and narrow it to the one agent or one environment you actually care about.
One incident, not a hundred identical rows
A single broken dependency can fire the same error hundreds of times a minute. Left raw, that is a wall of near-identical lines that buries the one thing you actually need to see. FailproofAI Observability collapses repeat failures that share the same session and error type into a single row. A burst reads as one incident. You end up counting problems, not log lines, and the signal that matters stays on top instead of being drowned out by its own volume.From “something is red” to the exact event
Click any row to land straight inside that run’s session, positioned on the exact event that failed. No copying session IDs, no scrolling to hunt for the moment it went wrong: you arrive right on it, with the full execution graph one glance away so you can see what the agent did in the moments before it broke. If you havealerts:write, every row also carries a + alert button. Click it and Observability opens a new alert rule already filled in to catch that same failure again. The incident you just triaged becomes the one that pages you next time, instead of surprising you twice.
Where to find it: the Errors page lives in the observe section of the dashboard, at /<org-slug>/errors.