

See every run at a glance
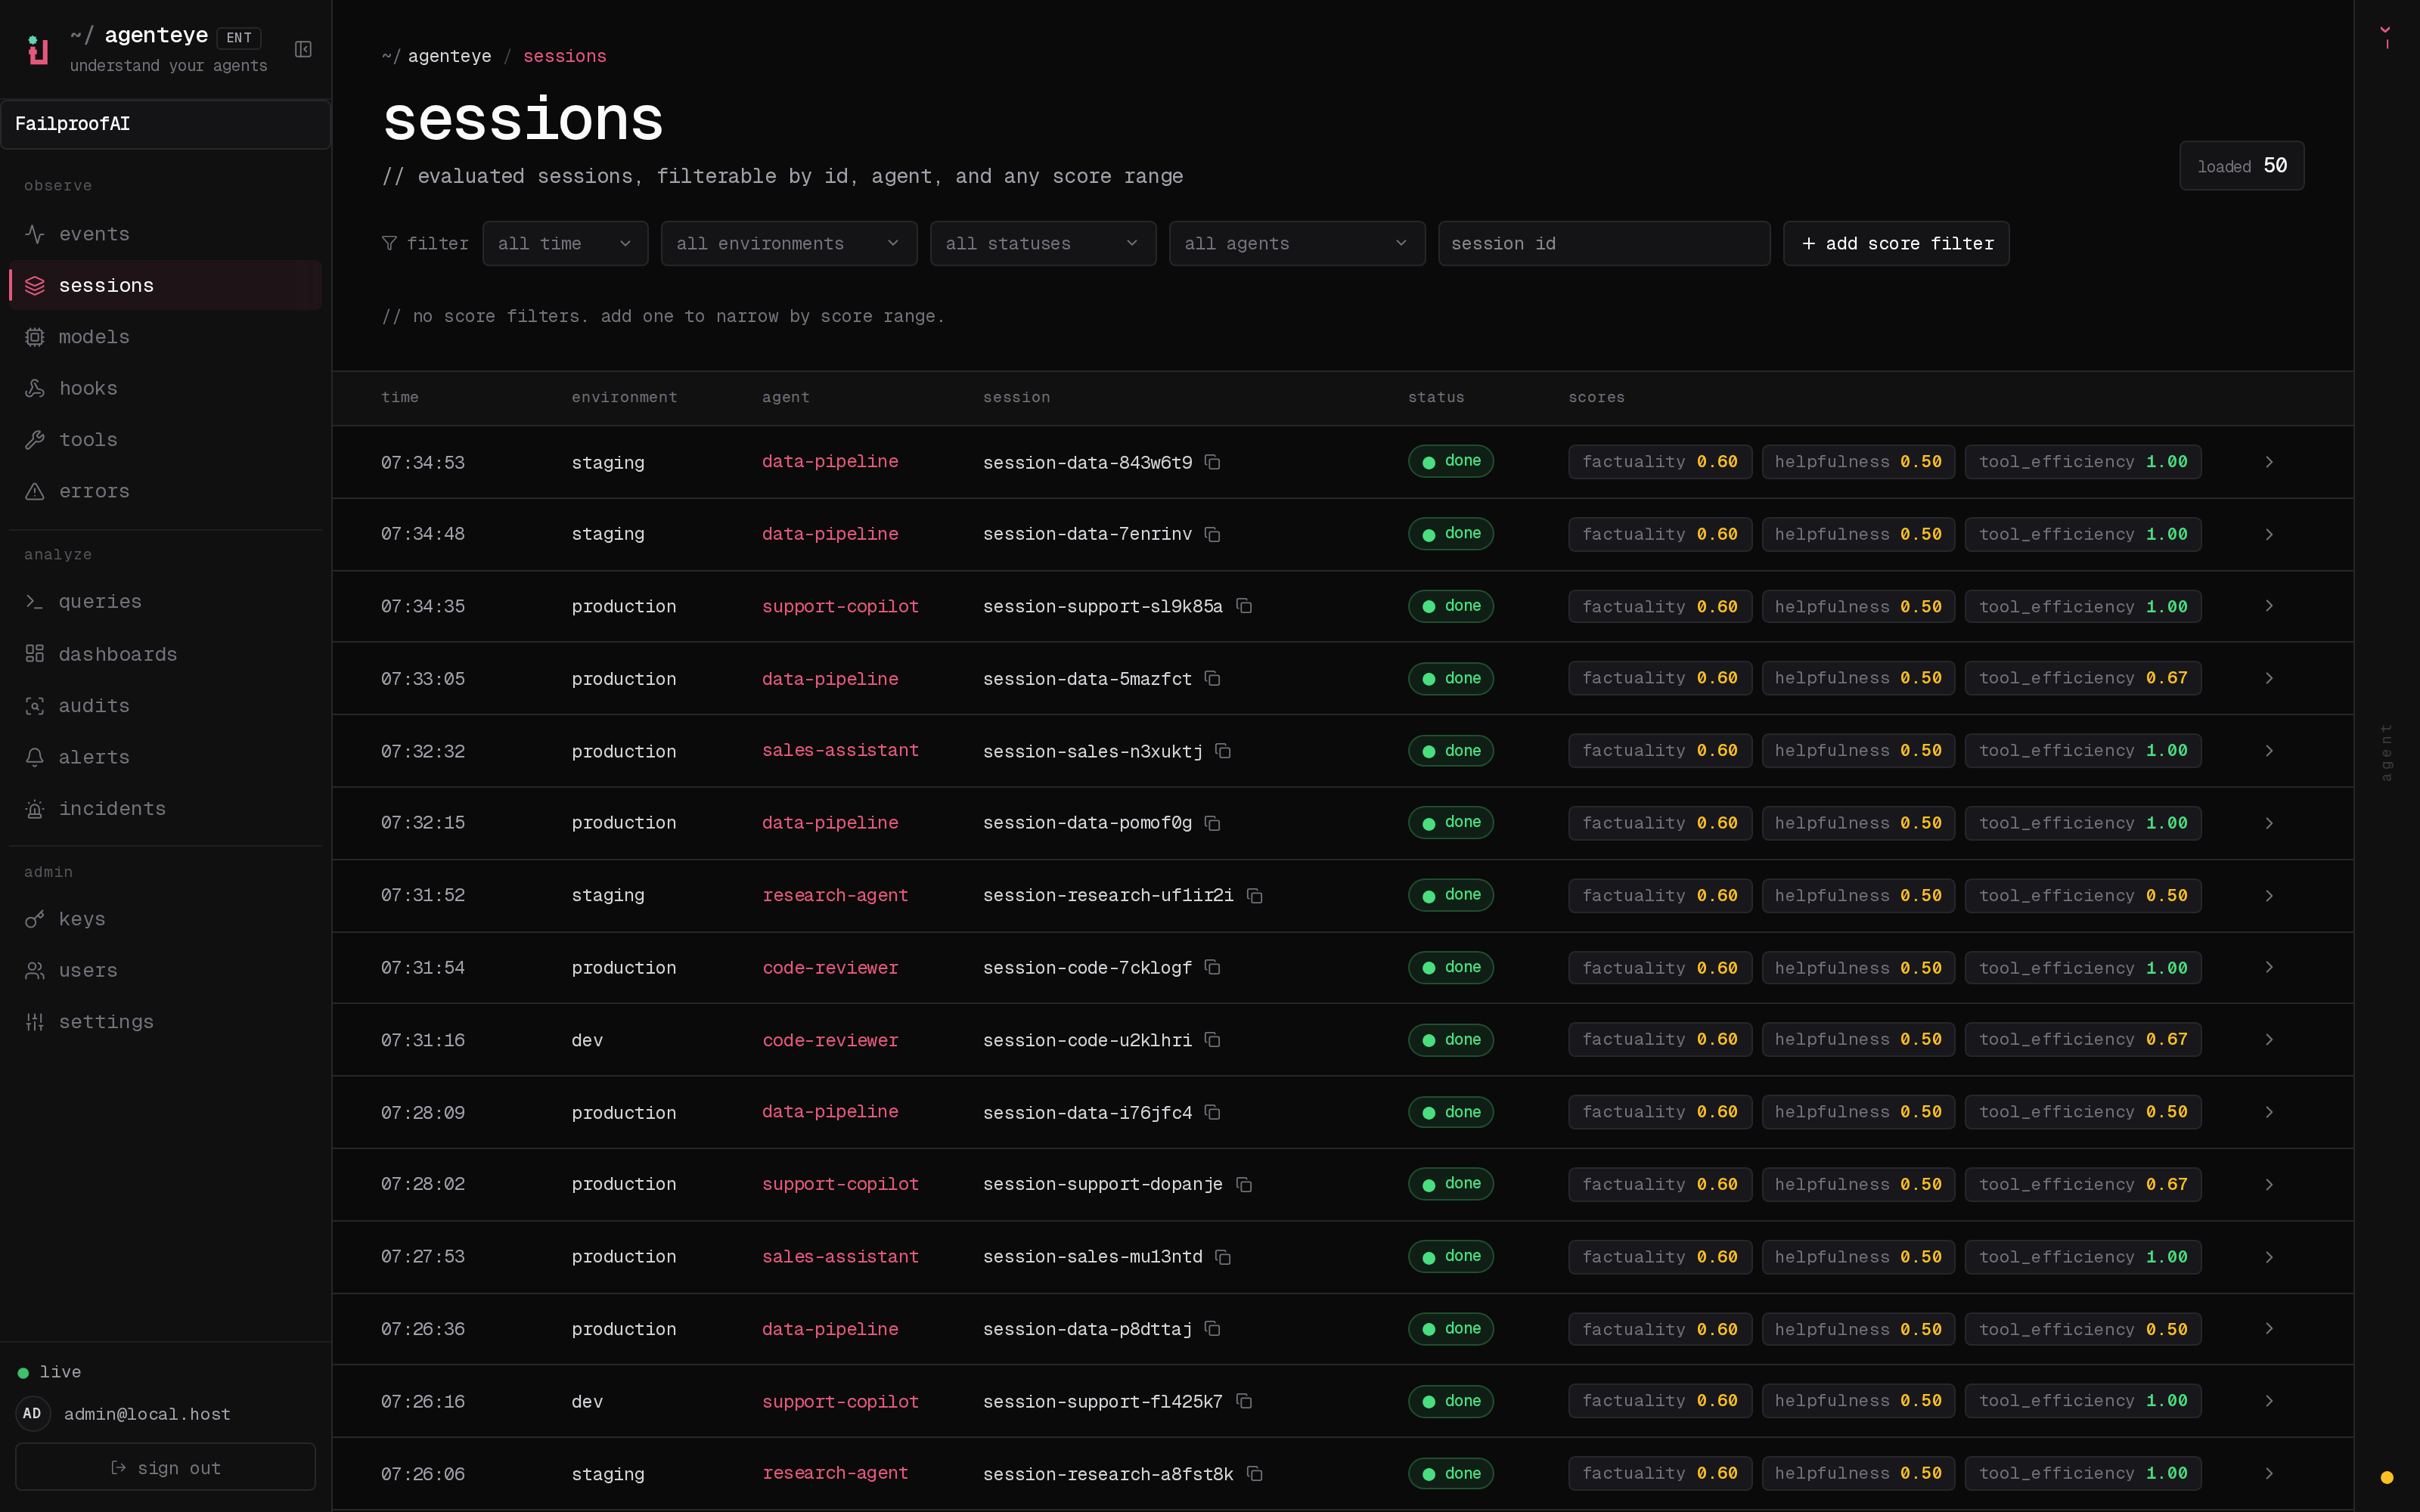
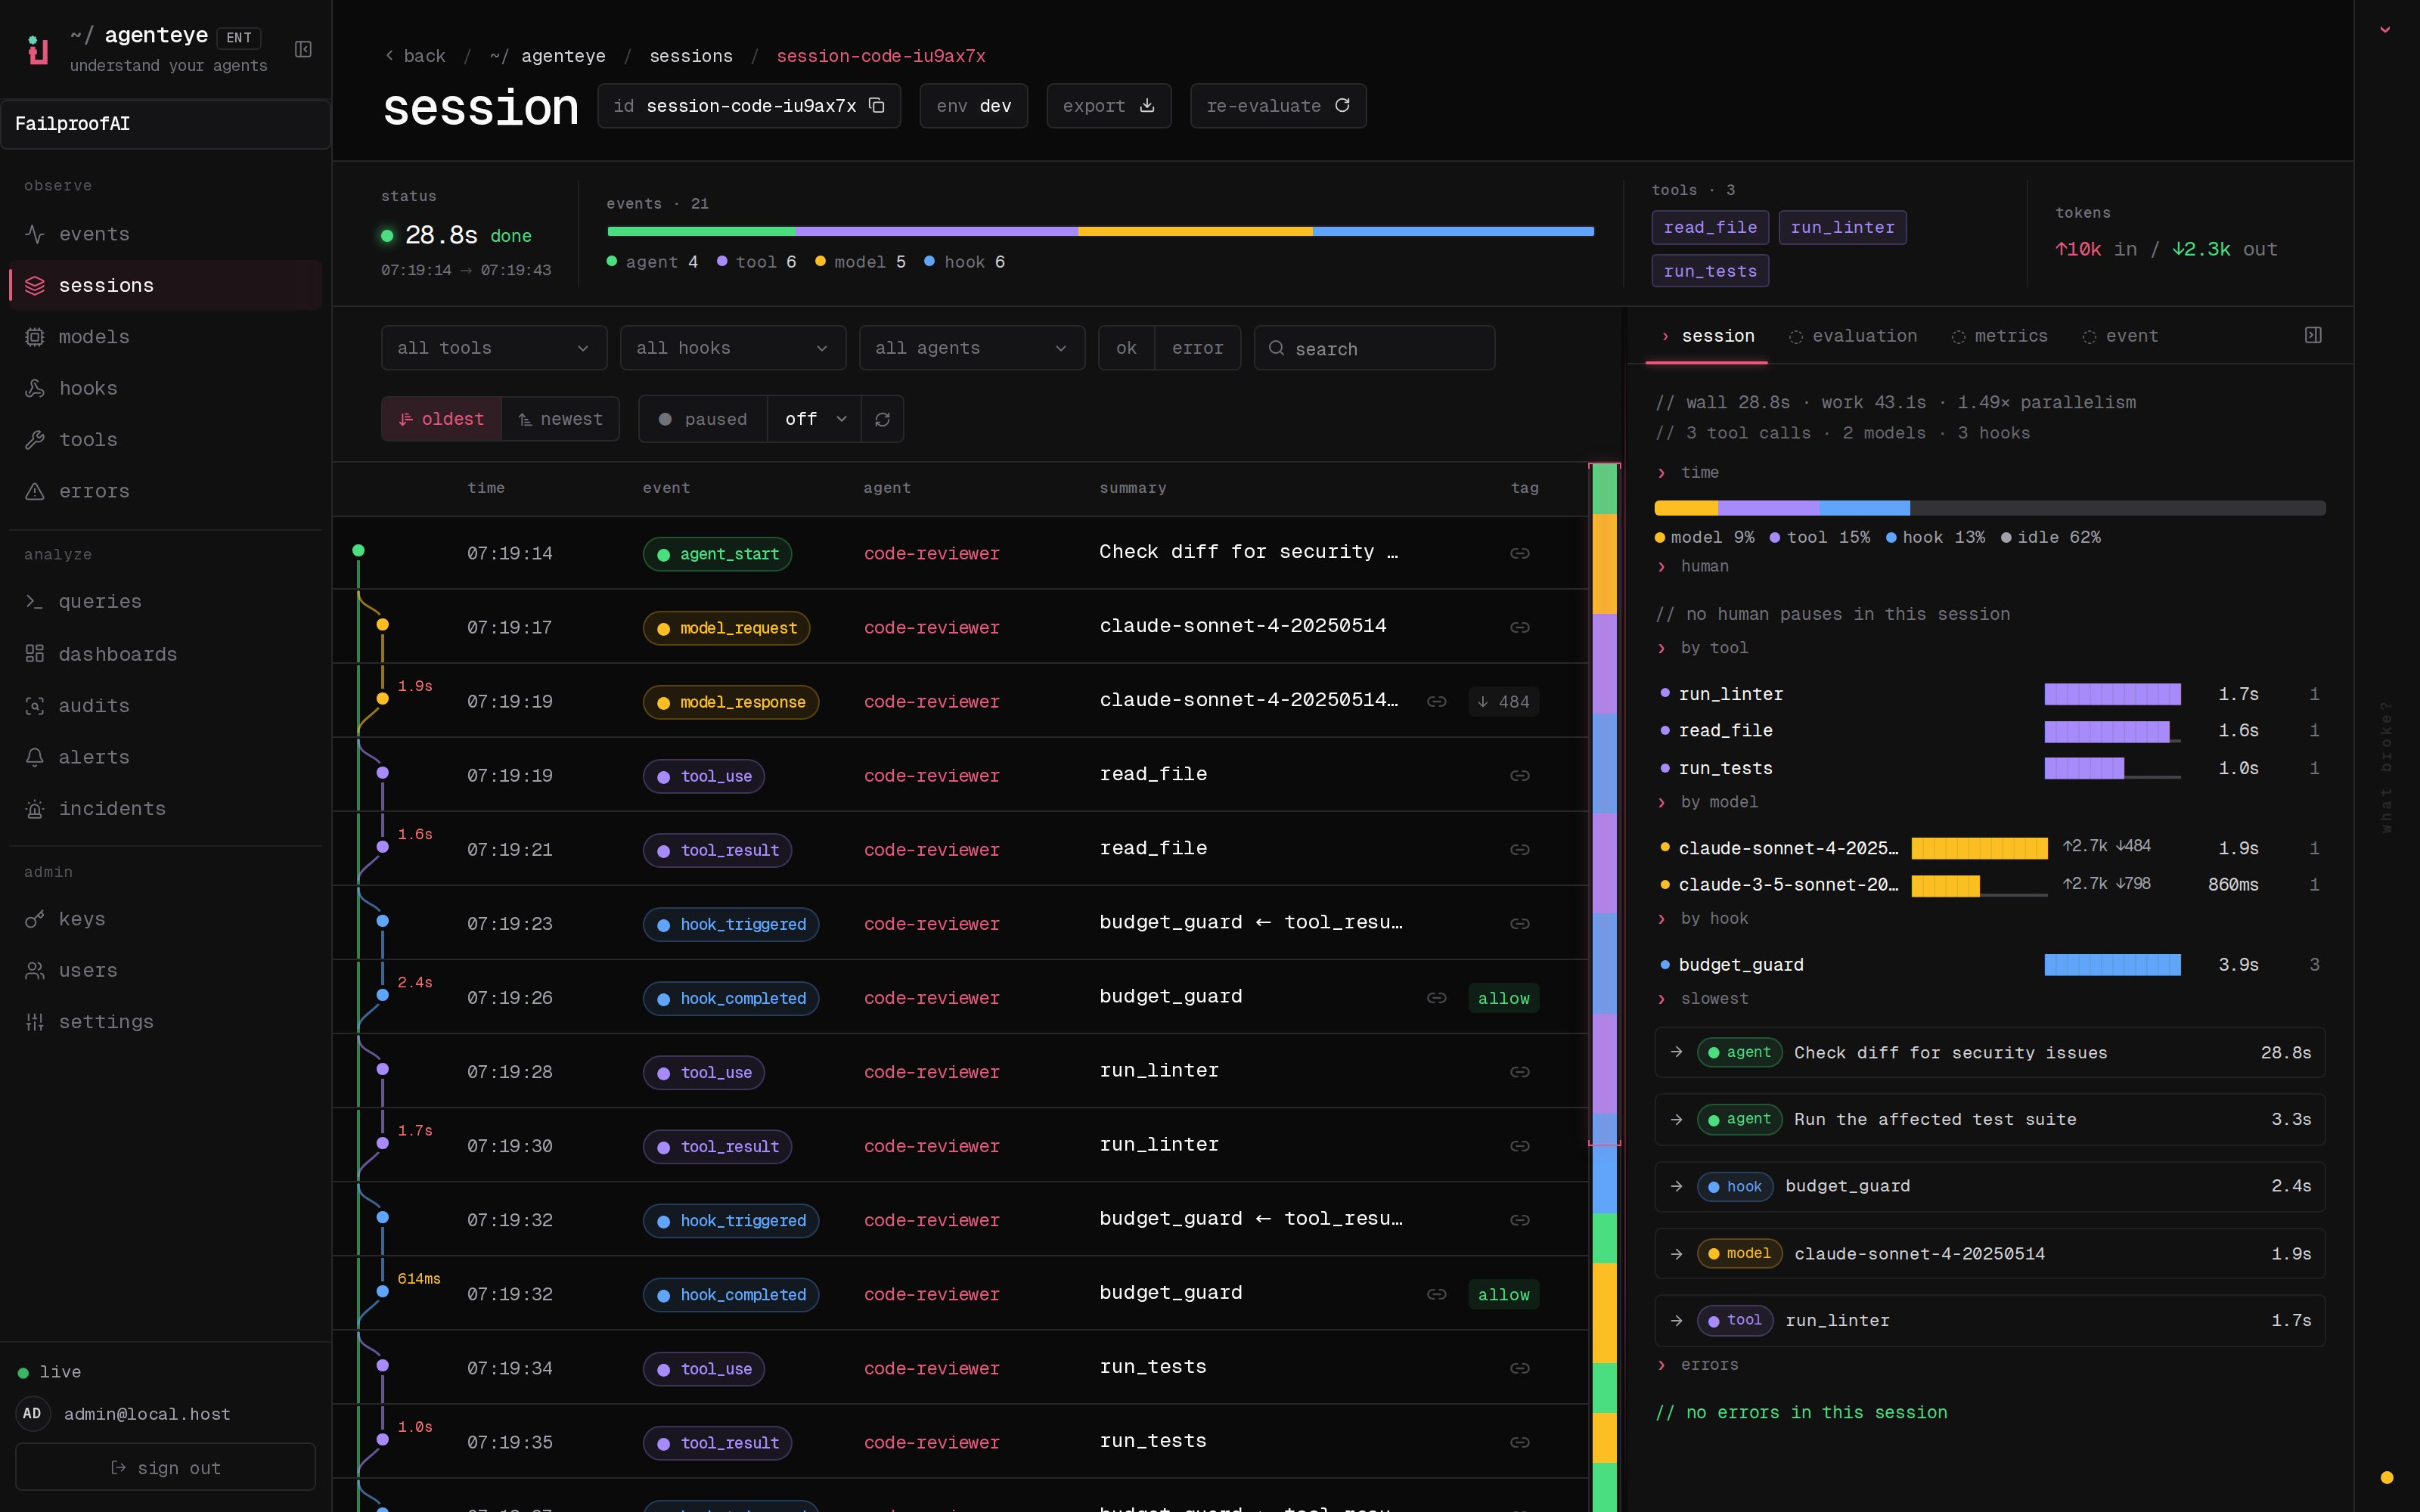
The raw event trail is the truth of every step, but when you have thousands of steps across dozens of runs, you need the run, not the step. The Sessions page rolls all of a run’s events up into one row, so a day of activity becomes a scannable list instead of a firehose. Each row carries a status pill, so a failed run stands out from a healthy one before you click anything. Filter by date range, environment, agent, or session to go from “everything” to “the run I care about” in a couple of clicks. Once you connect an evaluator, every completed run is scored automatically and its latest score shows up on the row as a badge. You can filter by any score range, so “show me every low-scoring prod run this week” is a filter, not a manual review. Until you set one up, sessions still capture the full run; they just don’t carry a score yet.Read the whole run as a picture
Where to find it
Every dashboard page is scoped to your org (/<org-slug>/…). Sessions lives under Observe in the left sidebar, next to Events, with the date range, environment, agent, and session filters across the top of the list. Every row is one click from its full execution graph.
To turn on the score badges and score-range filtering, connect an evaluator: see Evaluations.
Related
- Event stream: the raw, per-step trail every session is rolled up from.
- Evaluations: connect an evaluator so each run gets a score badge you can filter by.
- Telemetry: how runs get from your agent into these sessions.