

Stop sampling runs by hand
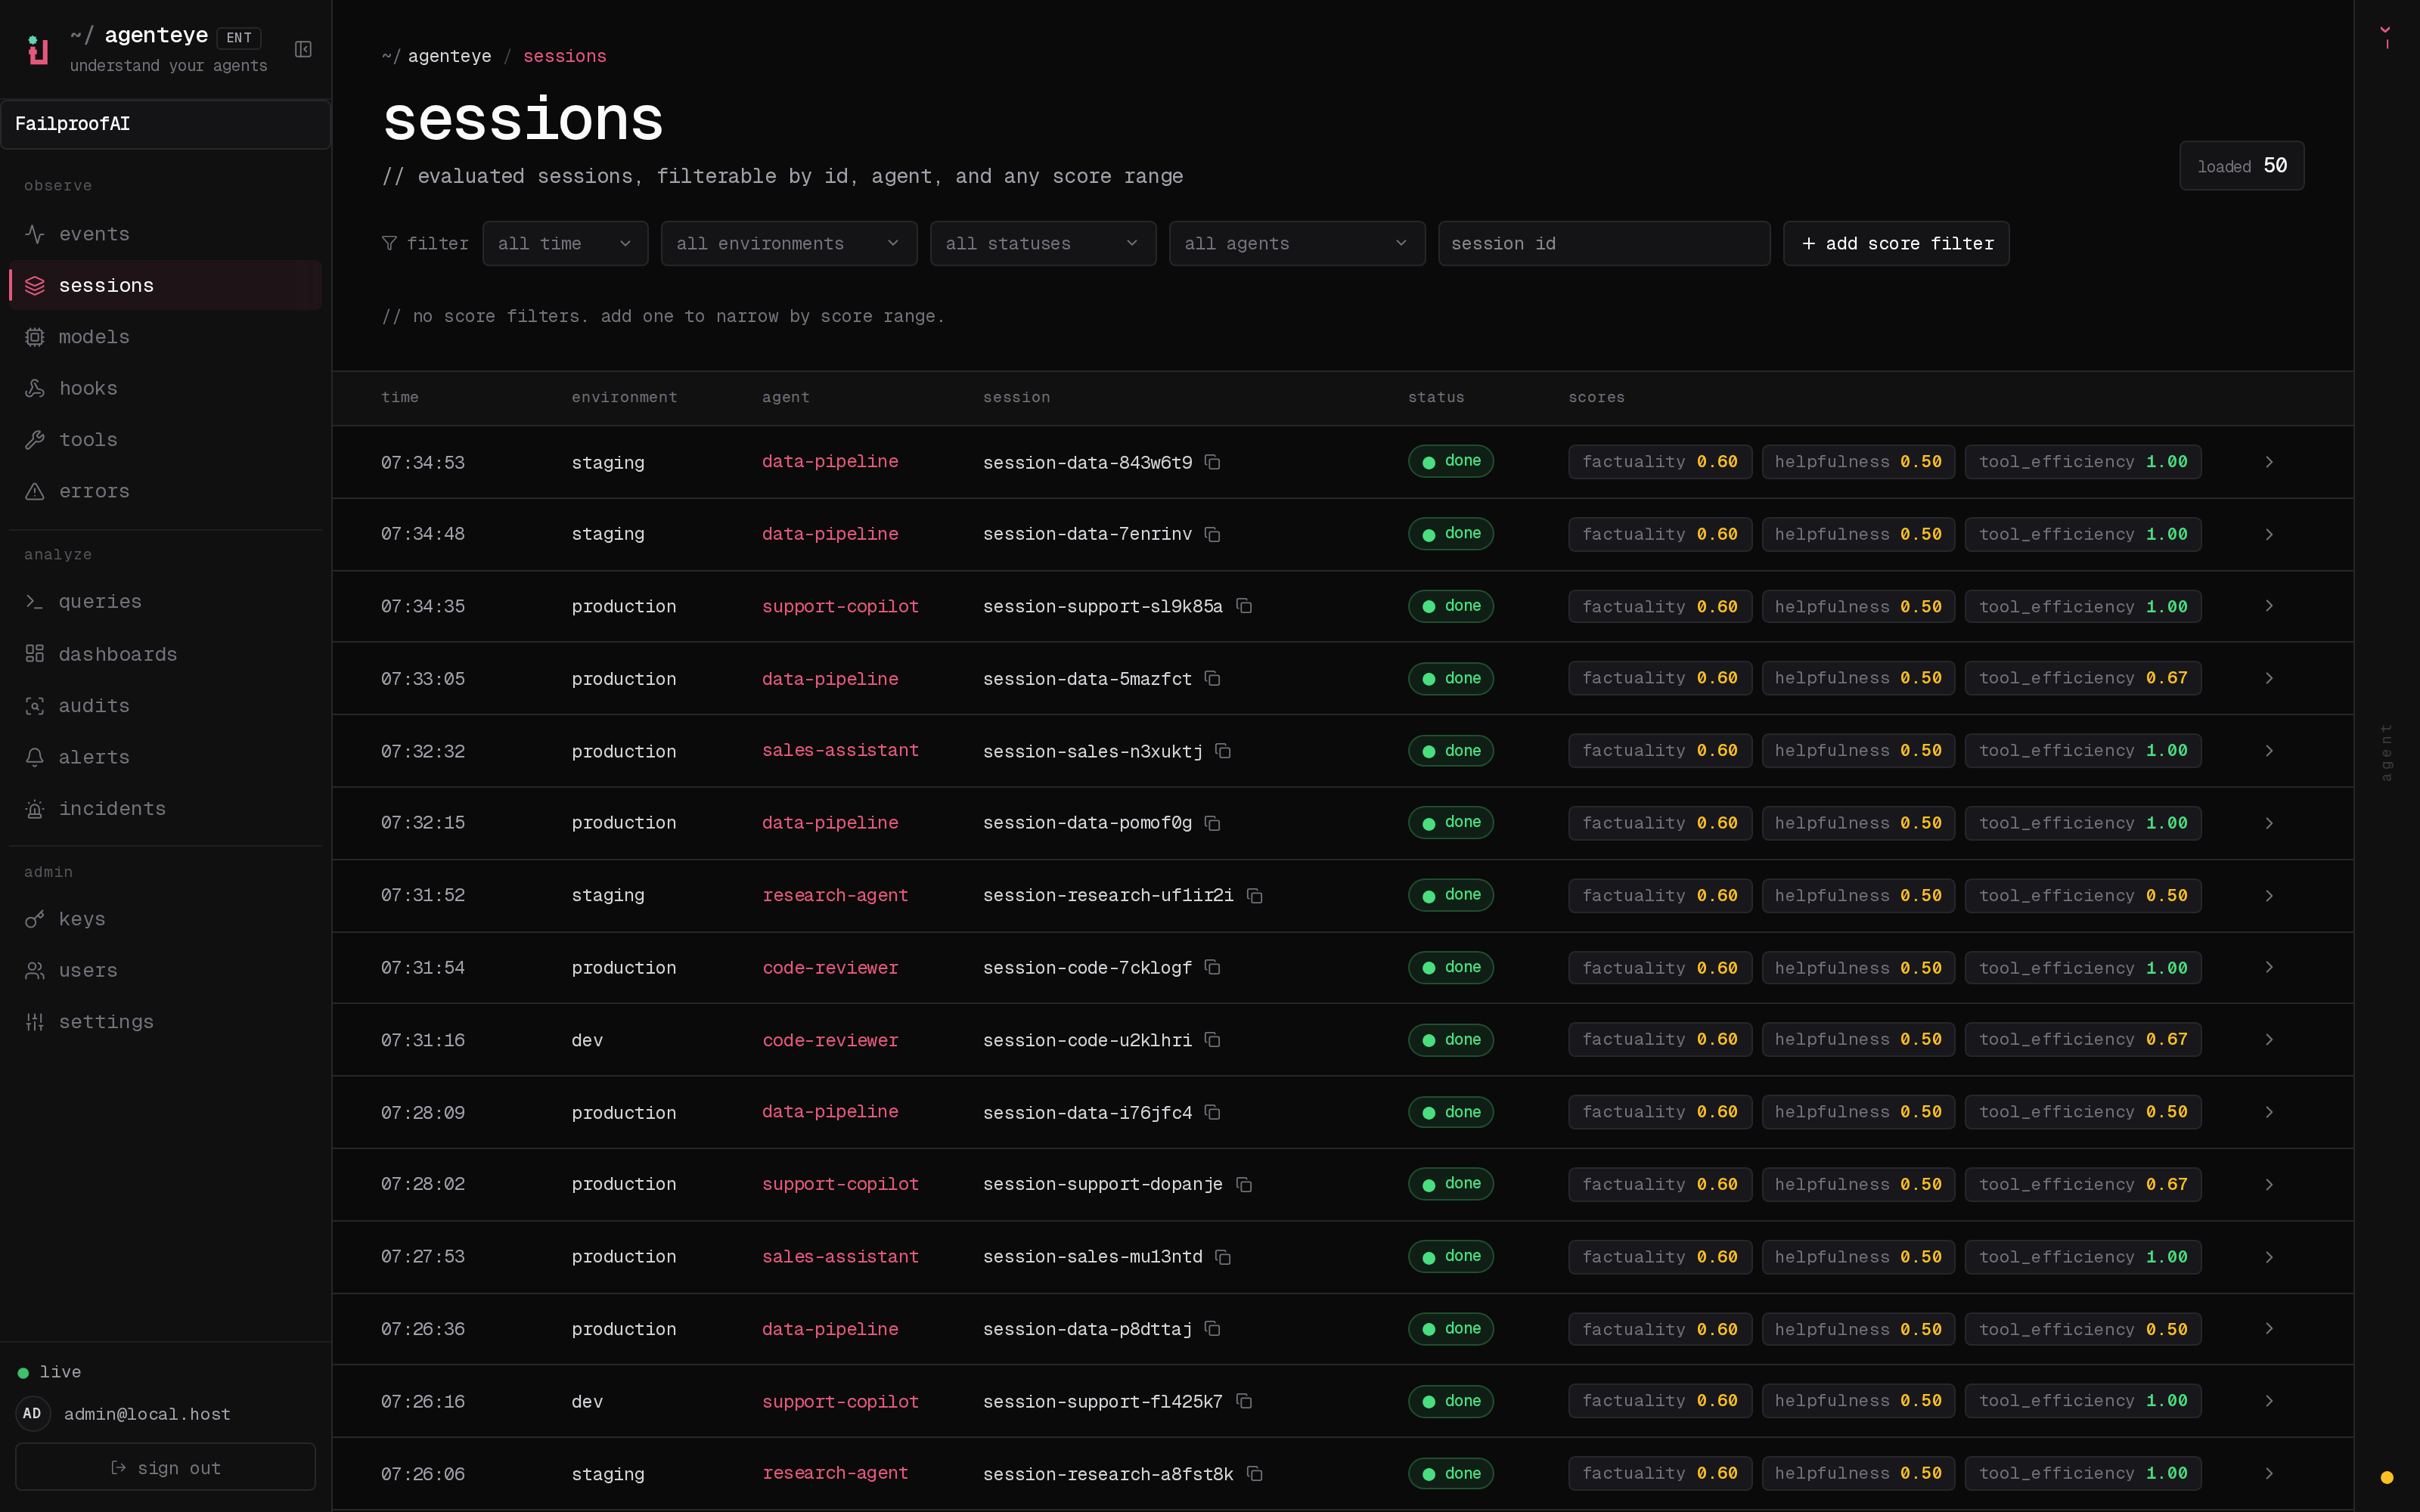
You used to spot-check a handful of runs and hope the rest were fine. Now every completed session is scored the moment it finishes, on the dimensions you care about: helpfulness, tool efficiency, factuality, safety, whatever your quality bar is. You define the score keys; FailproofAI Observability stores, trends, and displays whatever your evaluator sends back. No run slips through unscored, and you stop learning about a regression from a support ticket. The scores ride along on the sessions grid at/<org-slug>/sessions (sidebar → observe → sessions), one badge cluster per row. Want just the runs that fell short? Filter the grid by score range, say helpfulness below 0.5, and pull up exactly the runs worth reading. Viewing scores needs the evaluations:read permission.
See why a run scored low
A number tells you a run was weak; the session page tells you why. Open any run and the right rail leads with the headline summary, then shows a bar per dimension with your evaluator’s own reasoning under each one, so you go from “this scored 0.4 on factuality” to the exact claim it got wrong in seconds.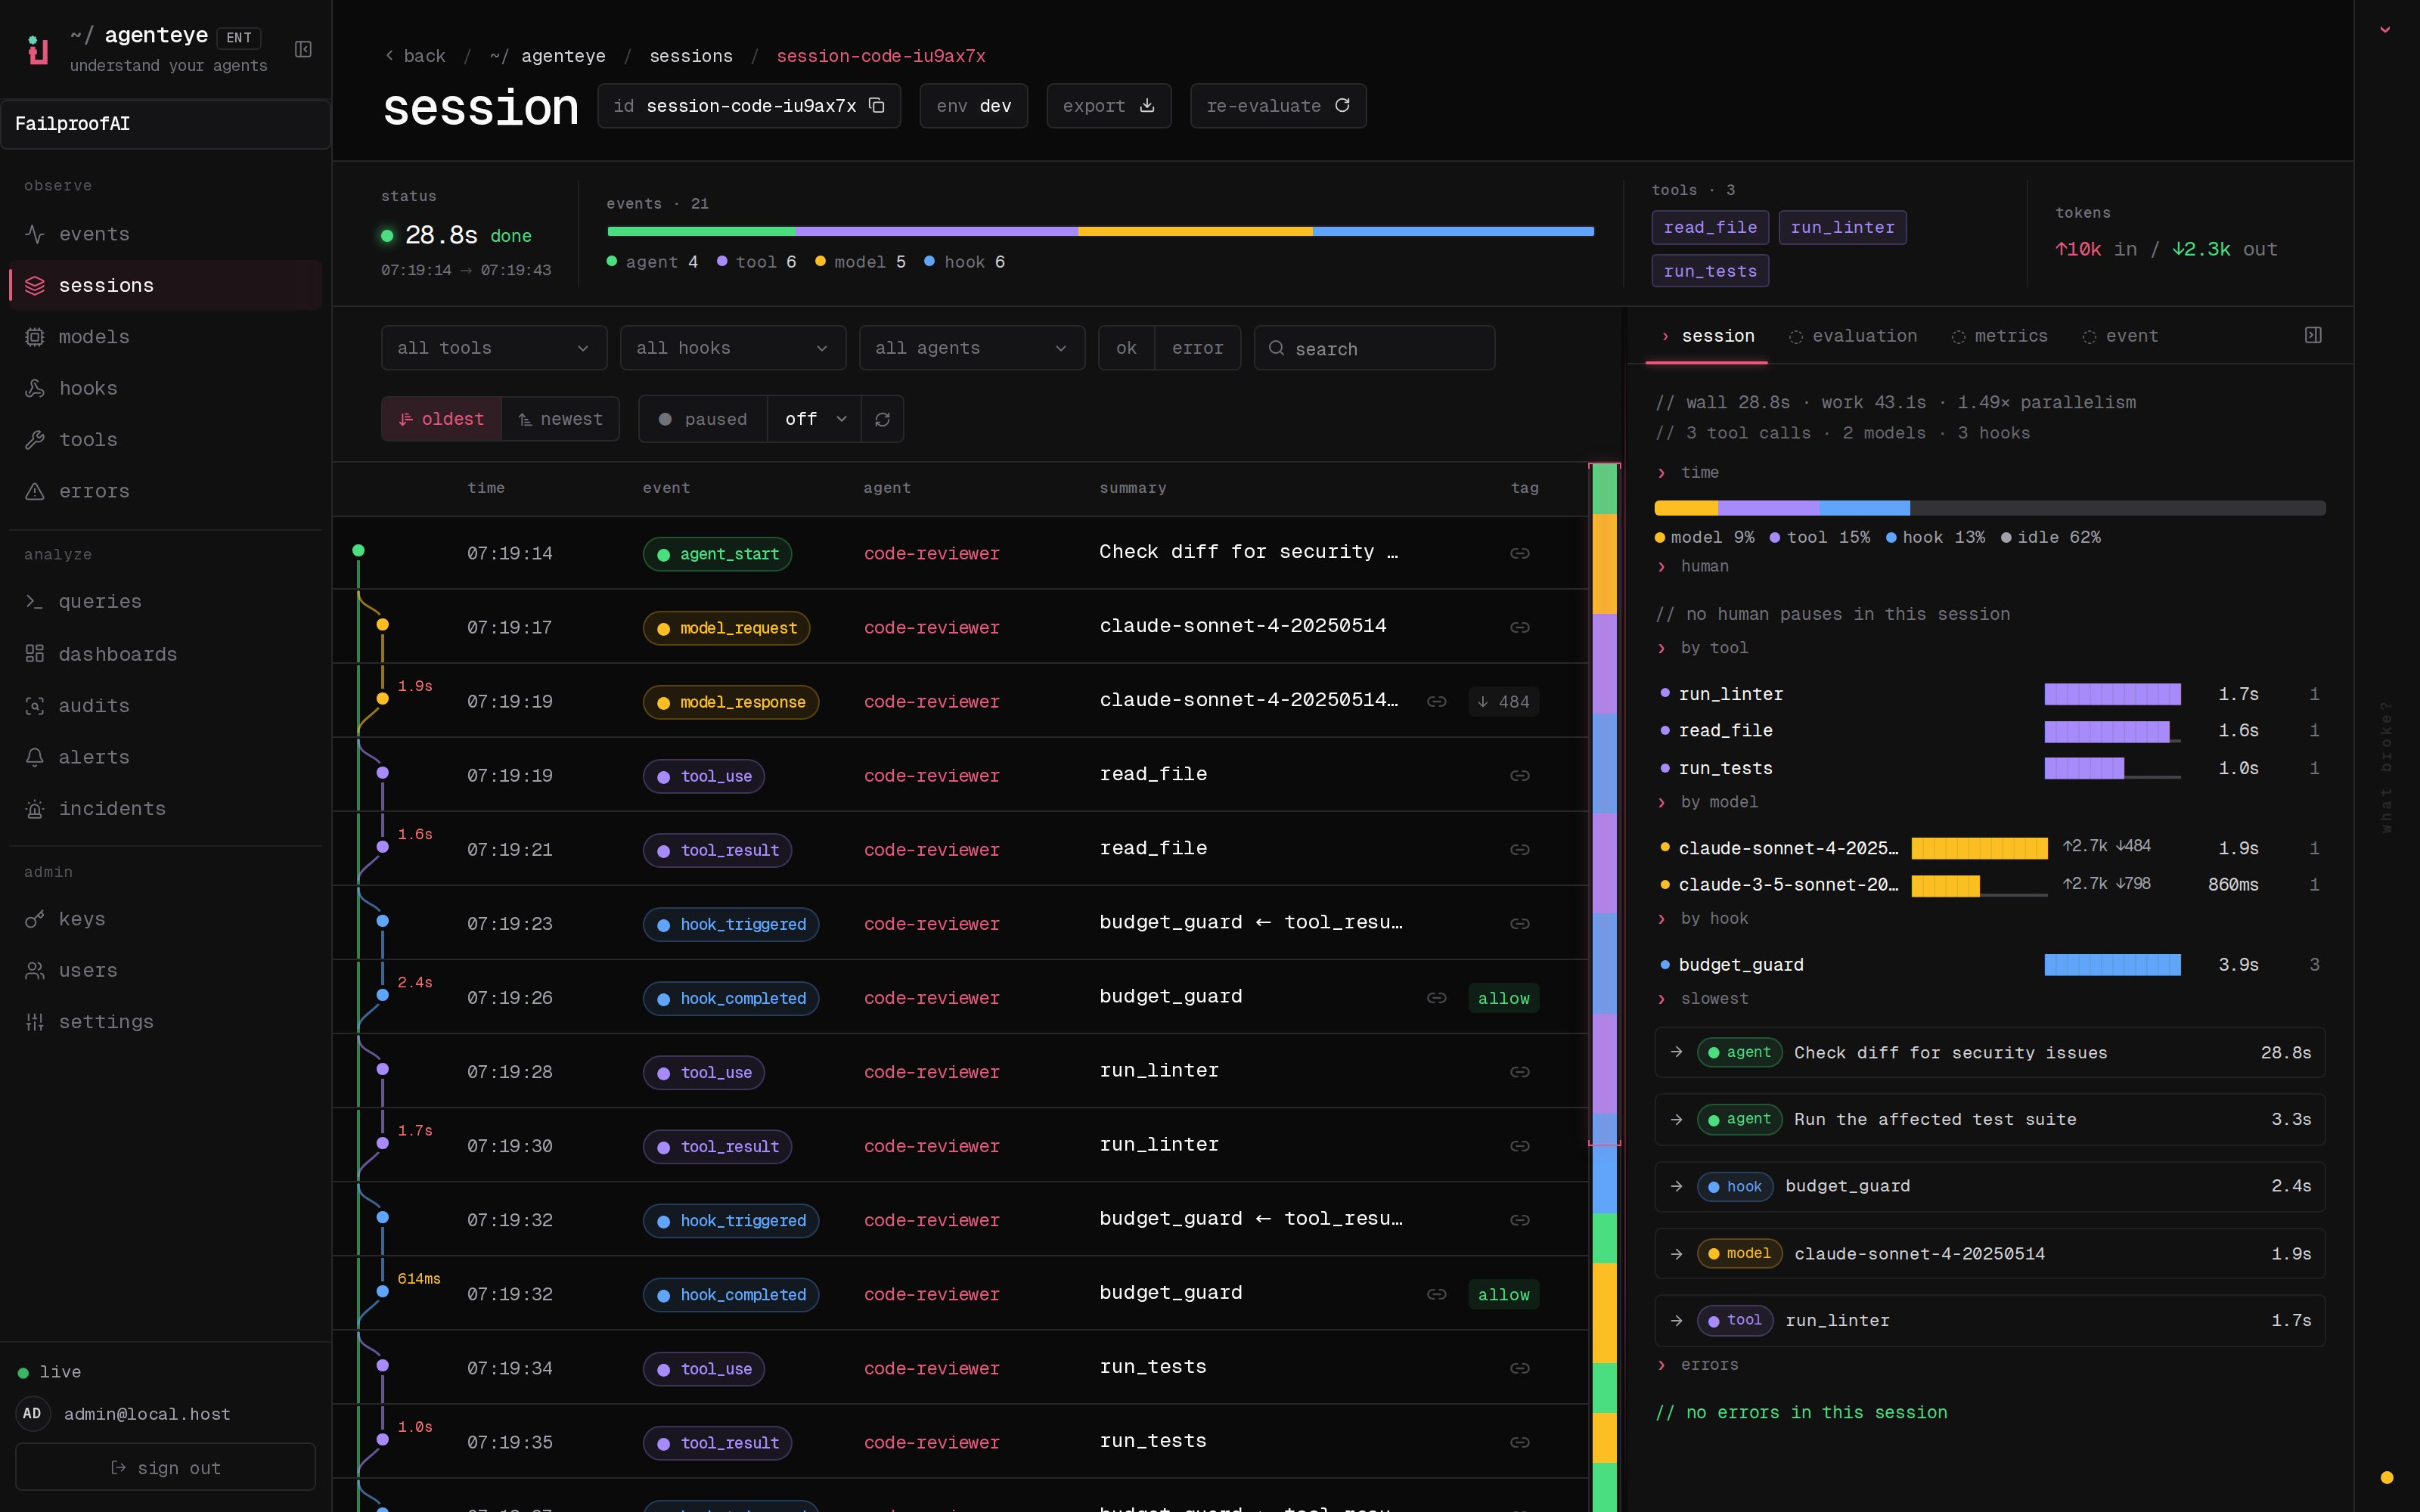
evaluations:trigger) re-scores the session in place and appends the fresh result to its timeline, so earlier scores stay visible as history. You will find it at /<org-slug>/sessions/<session-id>.
Watch quality trend across the fleet
One run scoring low is noise; a whole cohort sliding is a signal. Saved dashboards turn your scores into a trend you can watch at a glance: average helpfulness this week against last, per agent, per environment.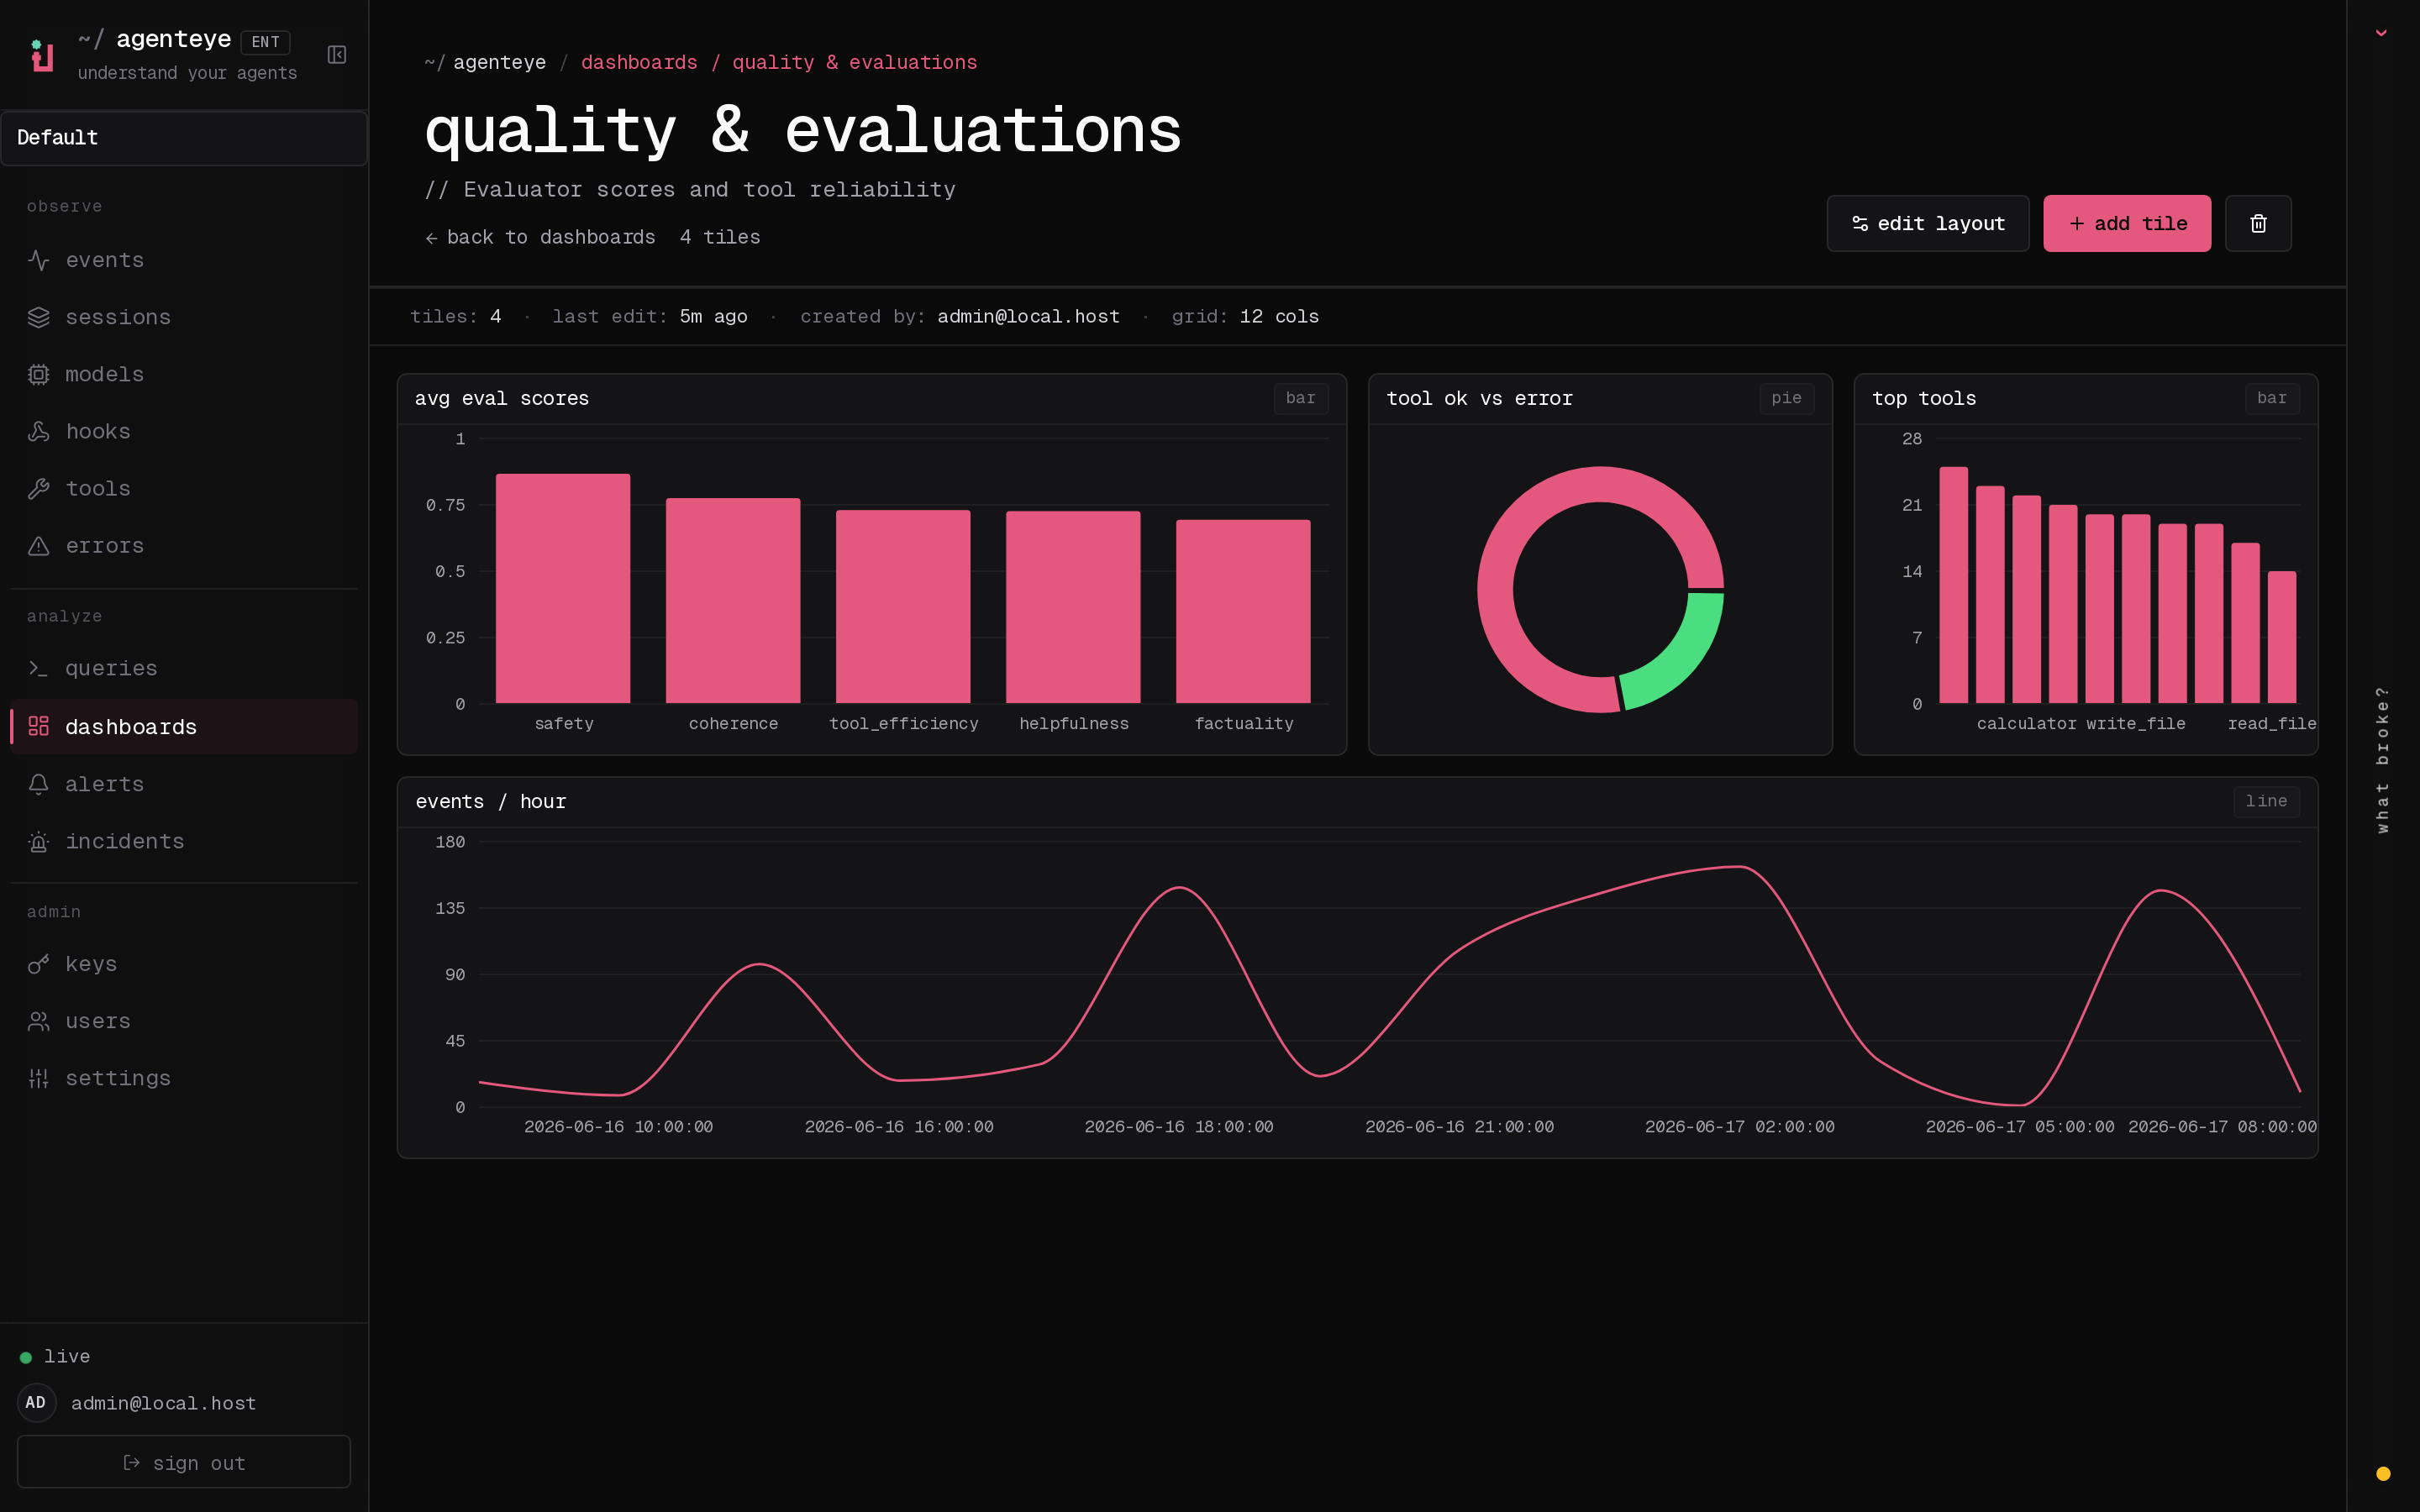
/<org-slug>/dashboards (sidebar → analyze → dashboards), are shared across your whole organization, and each card rolls up the matching sessions: how many, the average of each featured score, and a trend sparkline. “Open in sessions” drops you straight into the pre-filtered runs behind any number. Viewing needs dashboards:read plus evaluations:read.
Connect an evaluator once
Scoring is opt-in and stays completely off until you point FailproofAI Observability at a scorer. You stand up one small HTTP service (Observability ships a working reference you can copy), set two values on your server, and every run from then on is scored for you. The full walkthrough, the scoring contract, and the SDK live in the deep guide.Related
- Evaluation suite: connect your evaluator, the scoring contract, and the SDK.
- Sessions: the run-by-run grid where scores appear.
- Dashboards: save and share quality trends across your org.
- Audits: Observability’s other automatic quality feature, for cross-session investigations.