

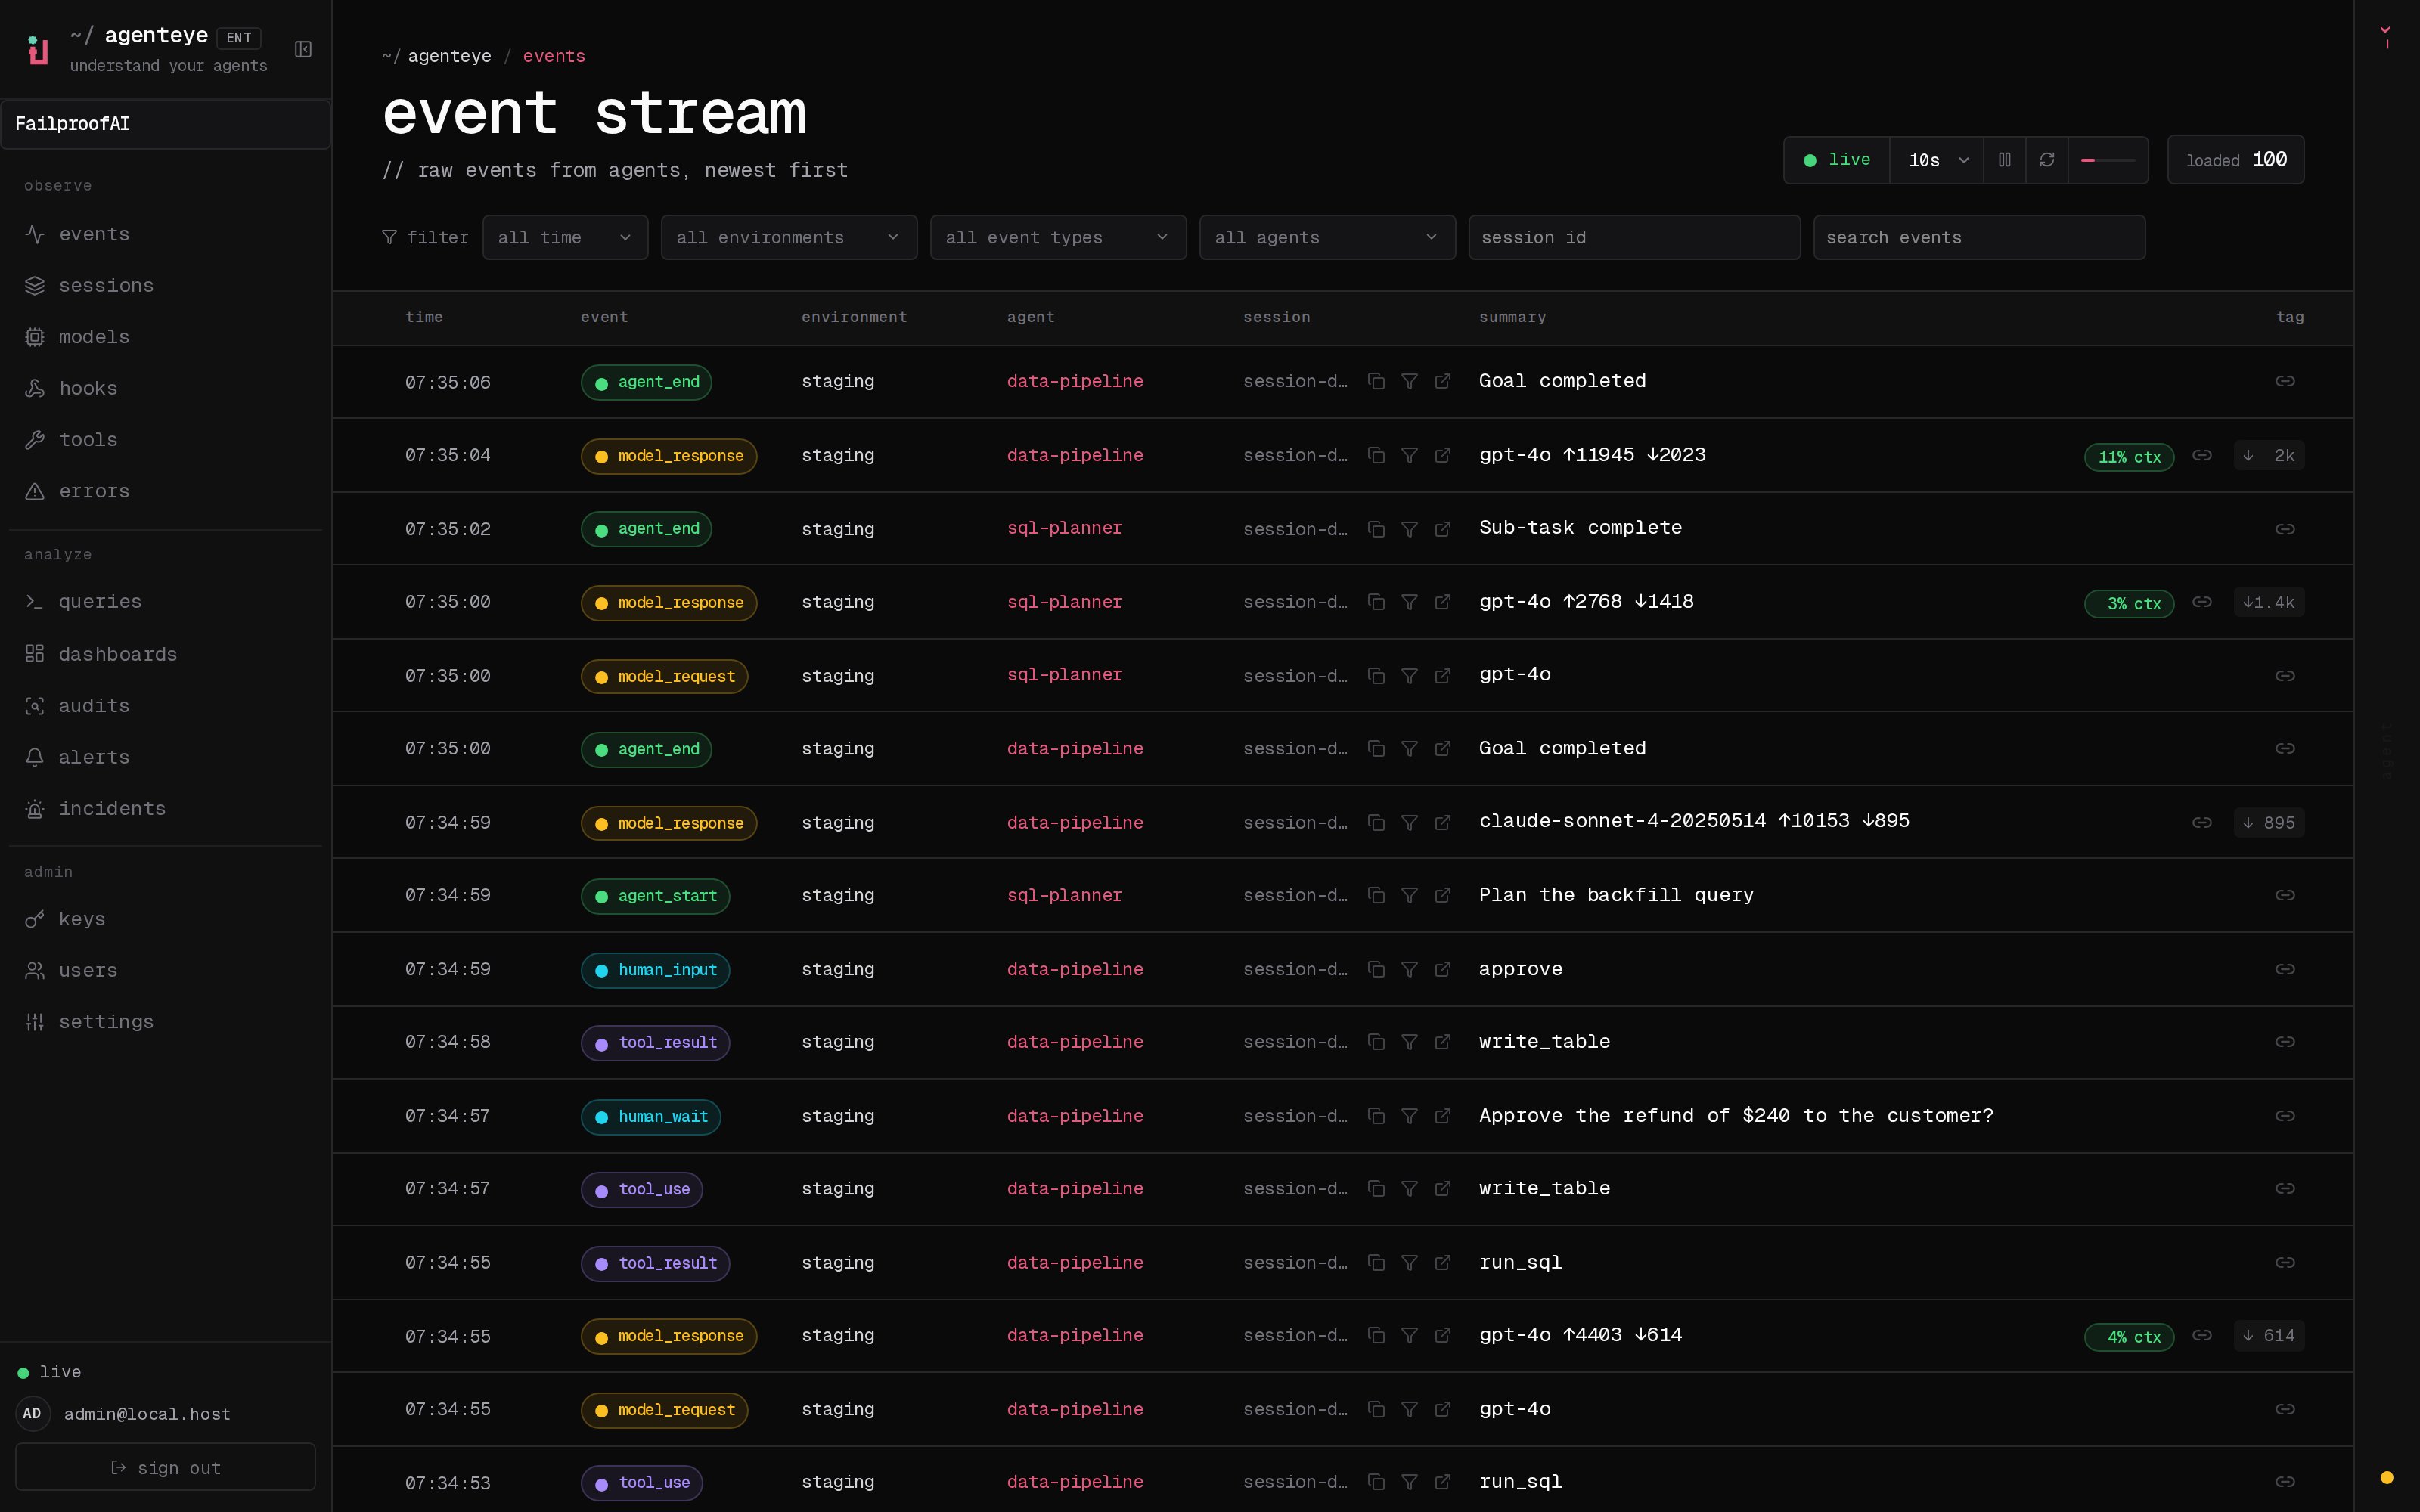
Your live pulse on every agent
When an agent starts a run, calls a model, fires a tool, runs a hook, or hits an error, the row appears at the top of the stream the moment it happens. It tails every event across every agent in your organization, newest first, so you always have a current picture instead of a stale one. That means no tailing log files on a box somewhere, no grepping across machines, no stitching timestamps together by hand. You open one page and you are already watching production. Rows are colour-coded by type, so you can read the stream at a glance instead of parsing every line. At a glance, each row shows you:- Its type, colour-coded:
agent_start,model_response,tool_use,hook_completed,error, and more. - A one-line summary of what happened, so you rarely need to open anything just to get the gist.
- Token counts for the step.
- A context-window fill badge where it applies, so prompt growth and an approaching compaction are visible before they bite.
Find the one run that matters
When something looks off, you don’t want the firehose. You want the single run that broke. The stream filters down fast: by environment, by agent, by session, by event type, or by free text. Filter by session id or agent id to follow one run from its first event to its last. Filter by event type to isolate a single kind of activity, for example everyerror across the org in one view. Stack filters to narrow from “everything, everywhere” to “this agent, in prod, erroring” in a couple of clicks, then act on what you find.
Free-text search cuts straight to a message, a tool name, or an id you already have in hand, so a customer report turns into the exact run in seconds.
Where to find it
The Event Stream is your org home. Sign in and it is the first surface you land on, at/<org-slug>/, so triage starts the second you arrive.
Behind it, your agents emit events through the SDK, the collector ships them to your FailproofAI Observability server, and the stream tails them as they arrive in infrastructure you control. When you want the rolled-up view instead of the raw trail, each run’s events collapse into a single row on Sessions, one click away.
This is the raw source of truth that every other observe surface builds on, so when a number looks wrong elsewhere, the stream is where you confirm what actually happened.
Related
- Sessions: the same events rolled up into one row per run, with a git-style execution graph.
- Telemetry: what your agents send and how events reach the stream.
- Error tracking: one triage surface for everything that went wrong.
- Alerts: turn any threshold into a paging rule.
- CLI and agents: the same live trail from your terminal.