

Compare scores over time
- Dashboard
- CLI
Go to Observe → evaluations.
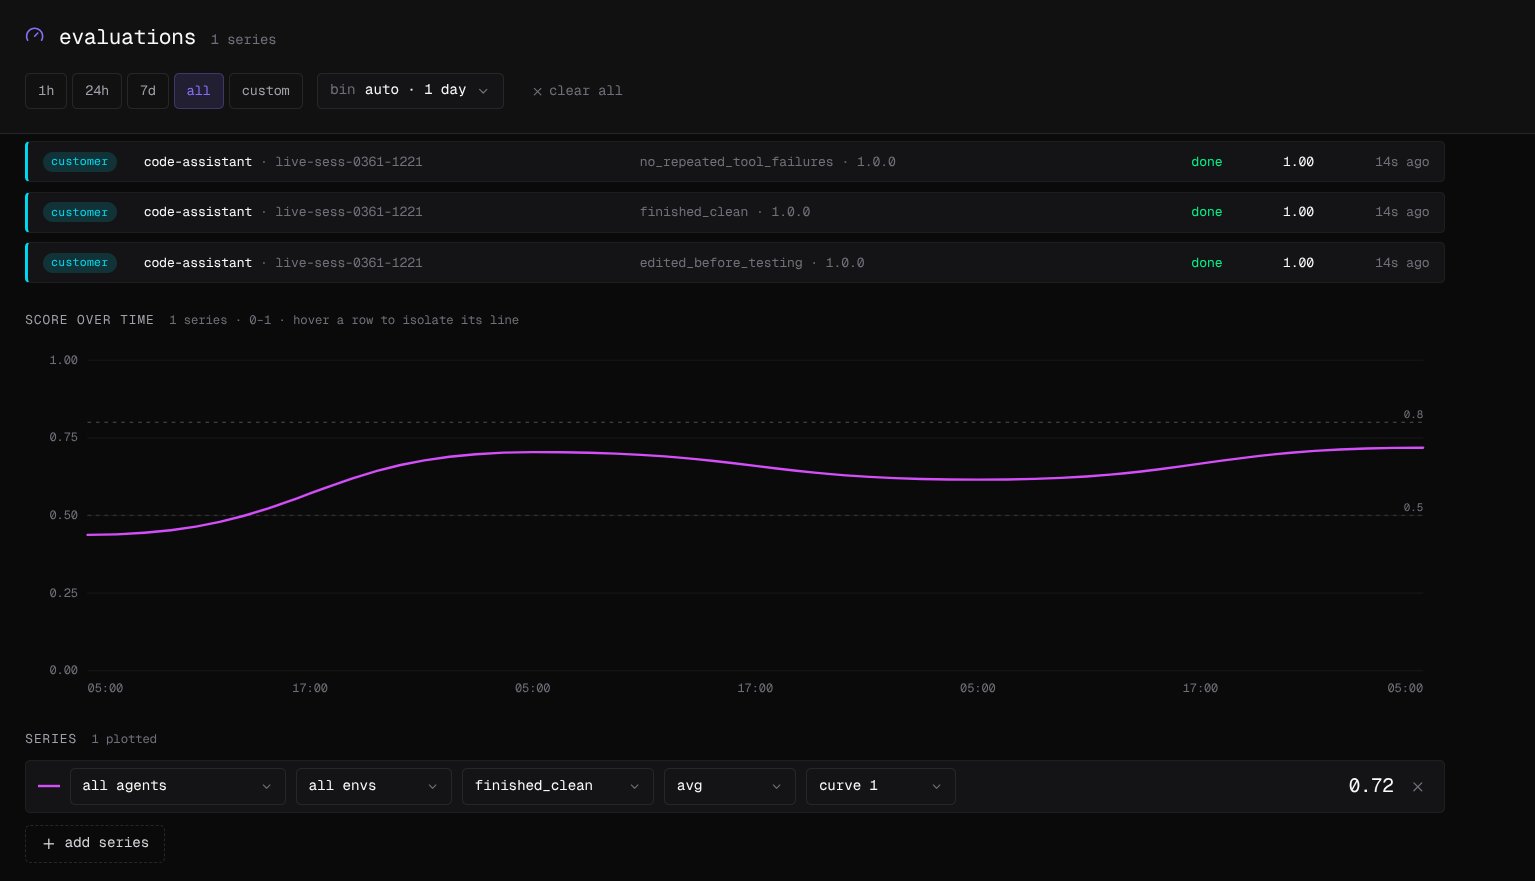
- Recent runs lists each evaluation as it lands: whether it came from a hosted (managed) or your own (customer) evaluator, the agent and session, the evaluation and its version, its status, and its score or metrics.
-
Score over time plots what you ask for. Select add series and choose an agent, an environment, an evaluation, and a statistic: avg, min, max, p50, p75, p90, p95, p99, stddev, or mode. Each series is one line; give it its own curve to draw it on a separate chart.
See why a session scored low
Open a session from Observe → sessions; the grid carries each session’s scores and filters by score range. The session’s right rail leads with the evaluation summary, then a bar per score with the evaluator’s reasoning under it.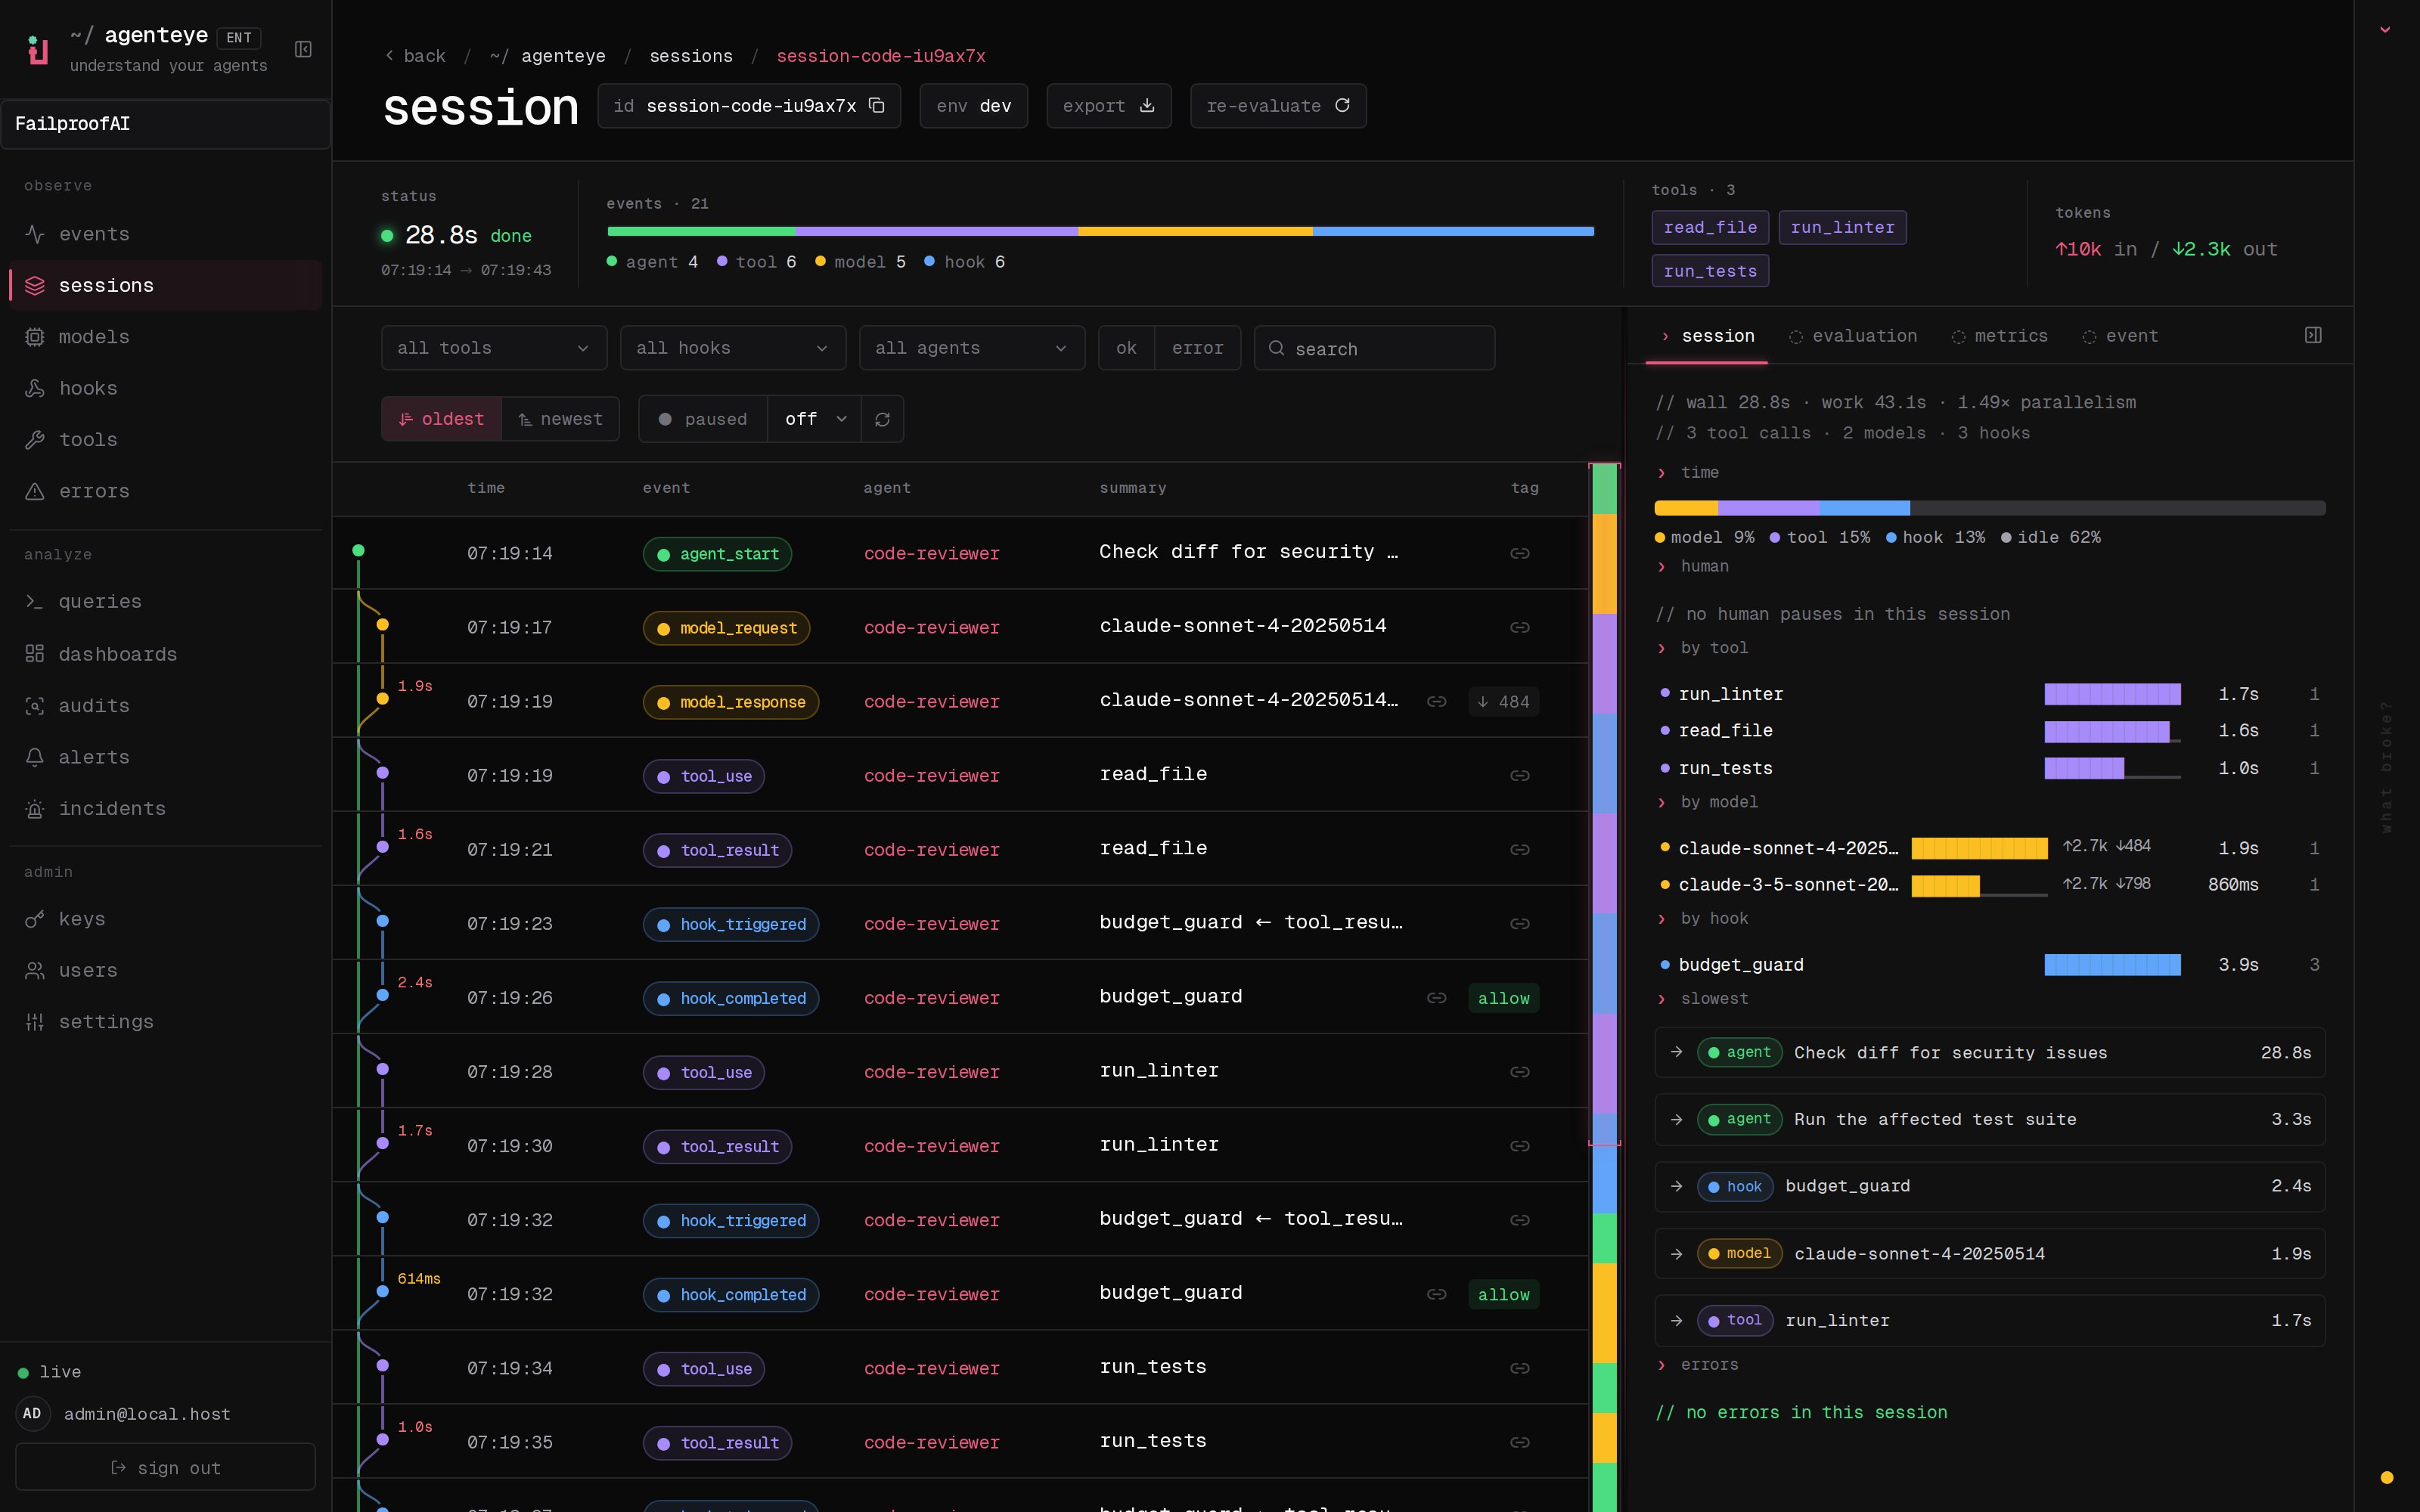
Ask the assistant
Ask about evaluation data in plain English: “tell me about some of the recent evaluations”, or which agents’ scores are slipping. The assistant reads and analyzes the results and answers with tables you can follow up on, and a question worth keeping can become a query or a dashboard.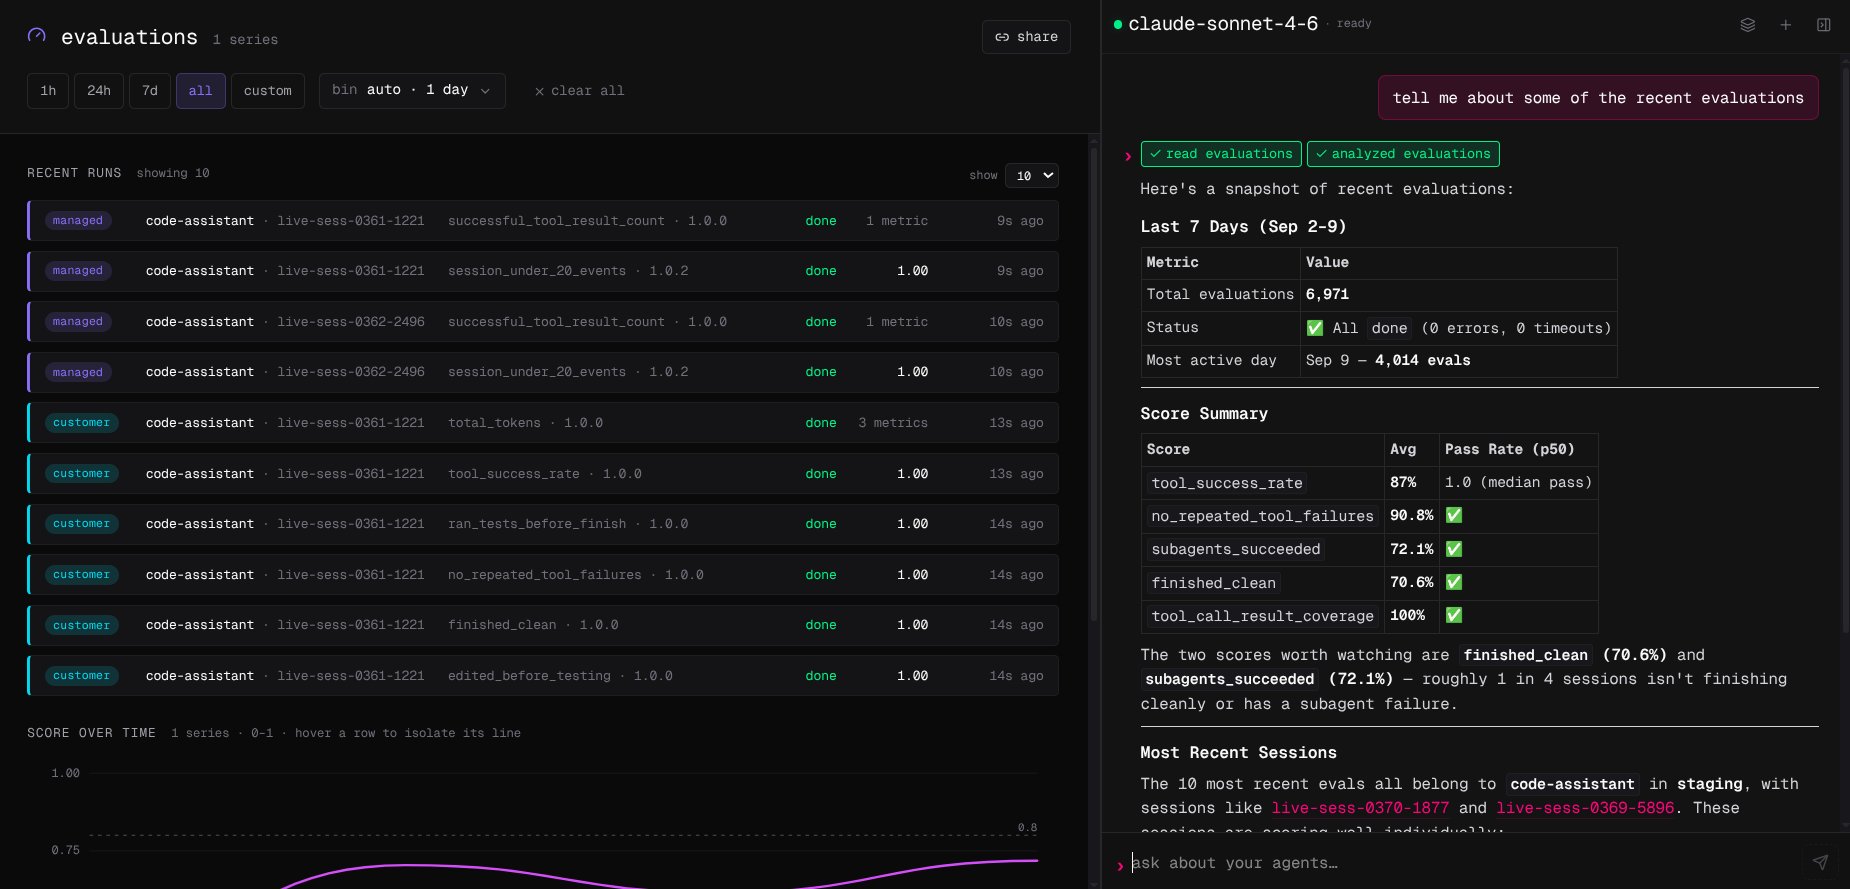
Watch and act
-
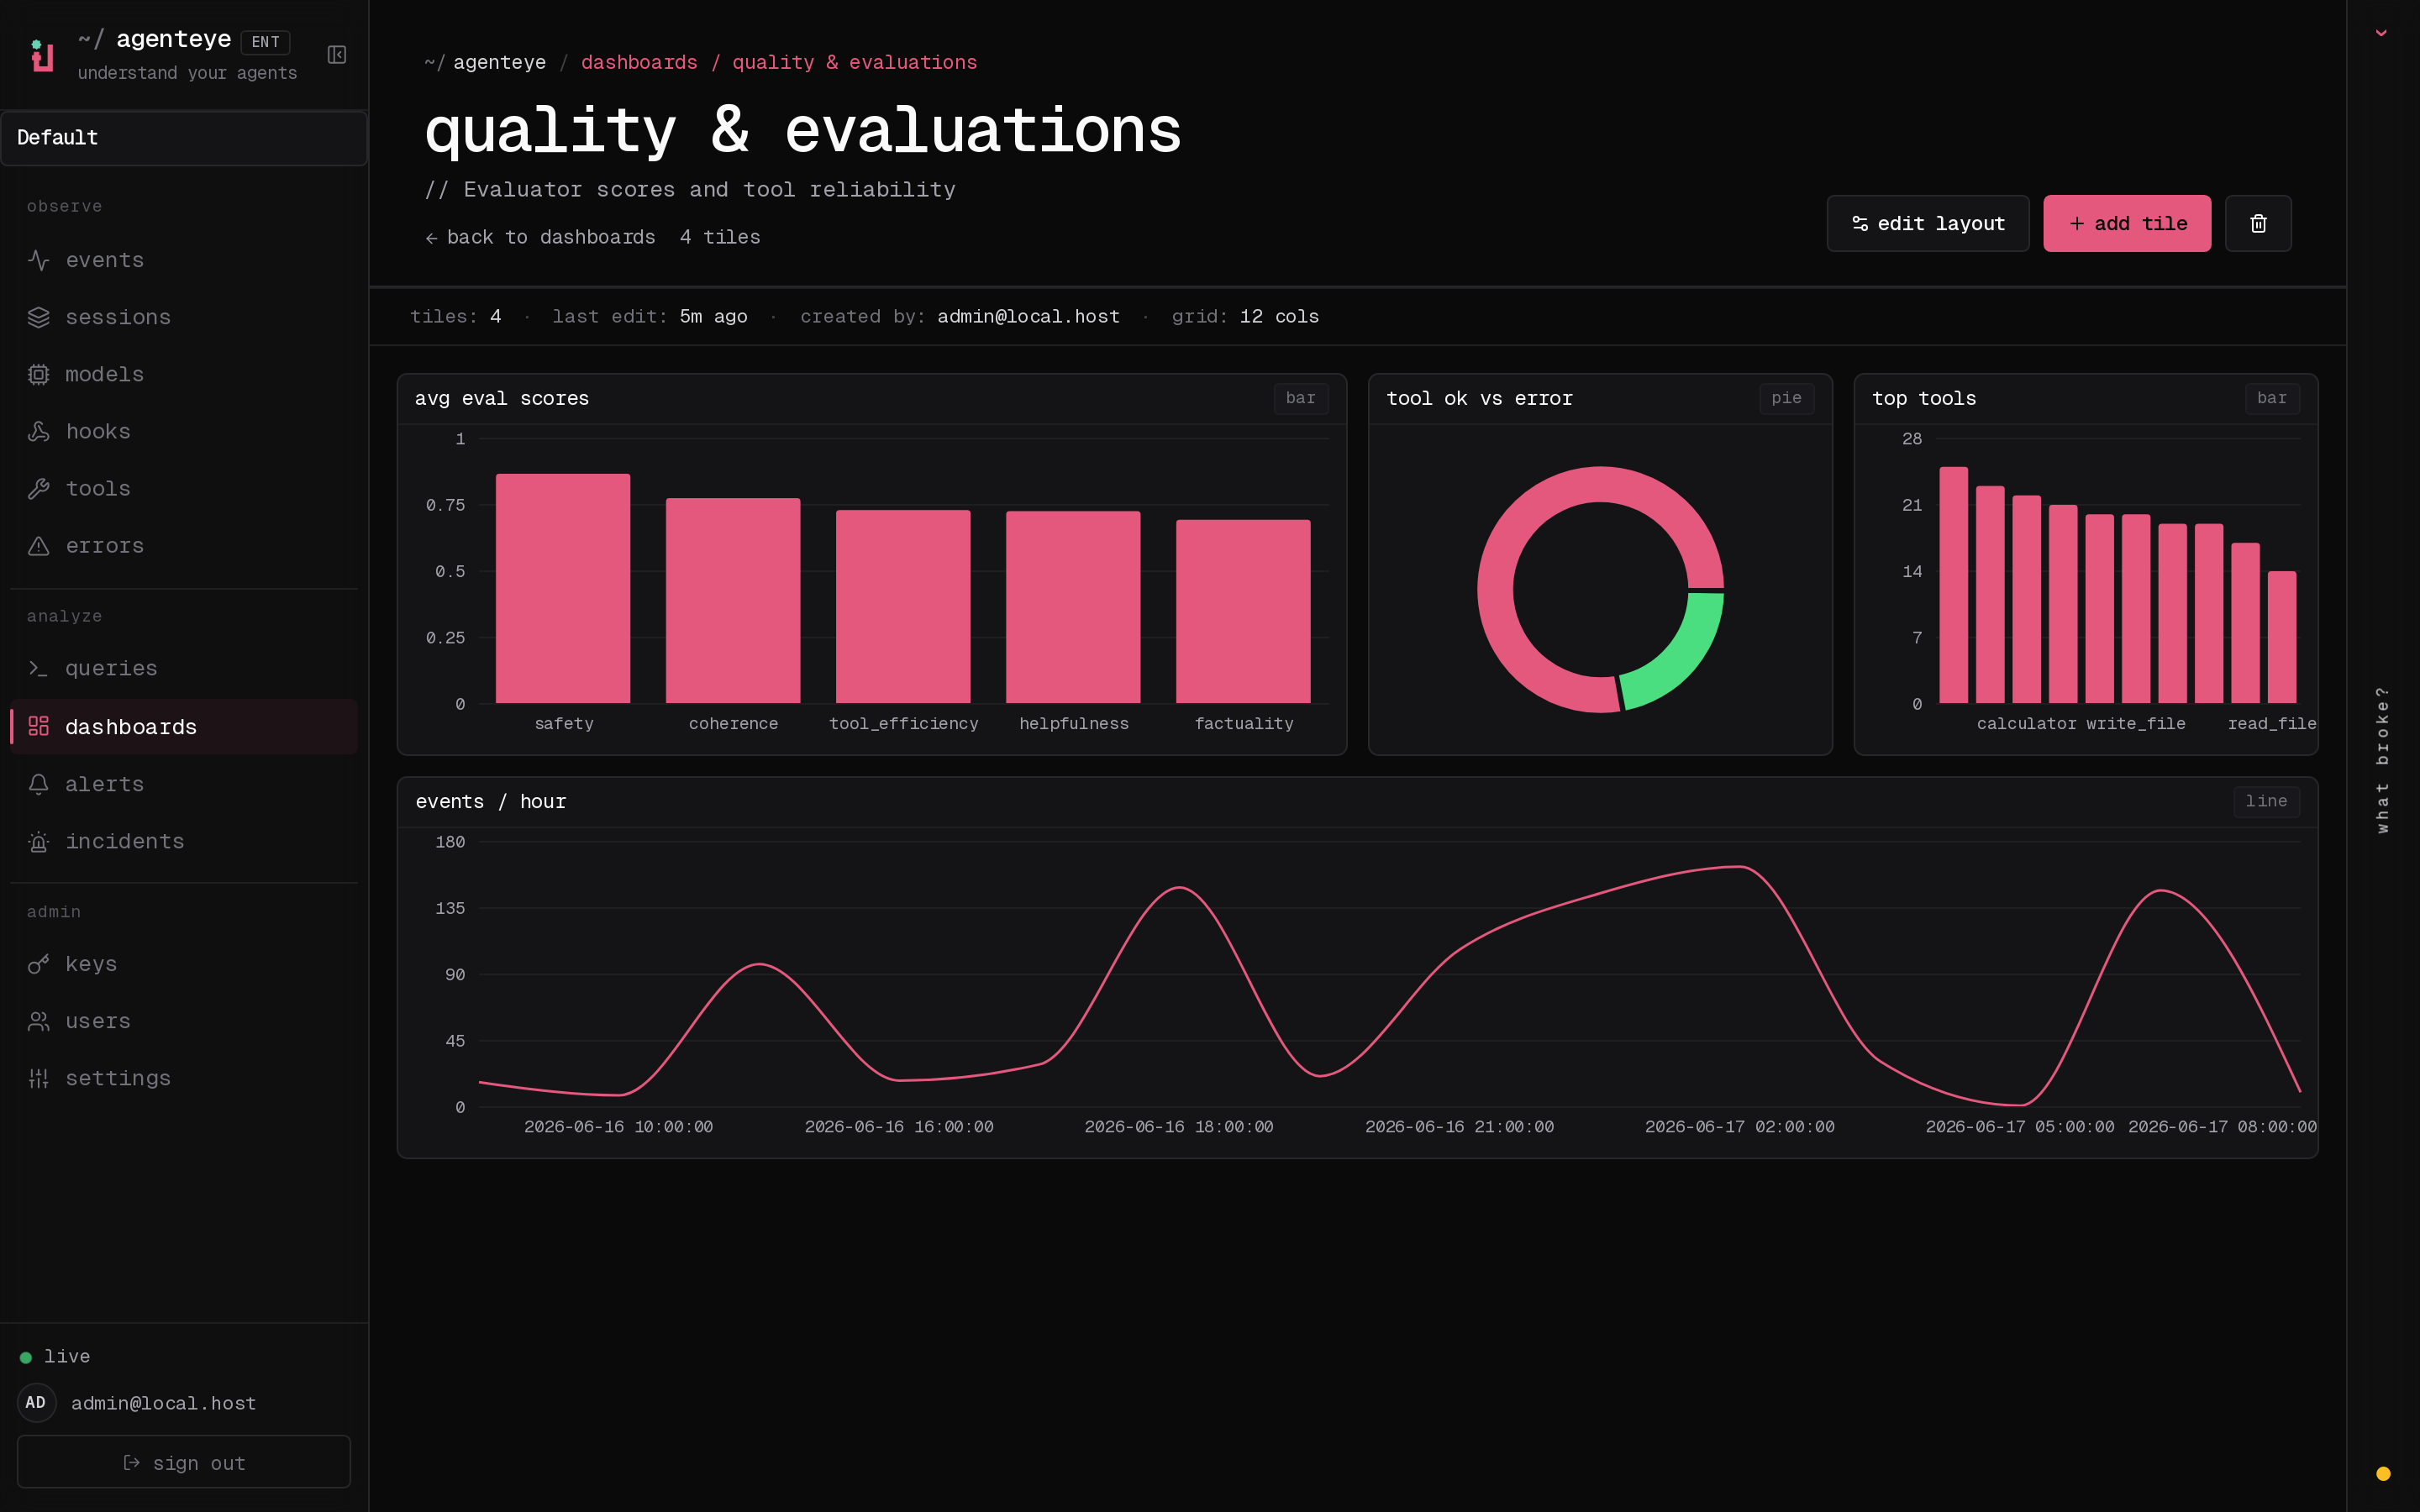
Dashboards, under Analyze → dashboards, trend the scores you feature, per agent and environment, for the whole organization.
- Alerts notify you when a score crosses a threshold. See alerts.
- When a score declines across many sessions, run an audit to find out why; when the cause is a repeatable action, write a policy.